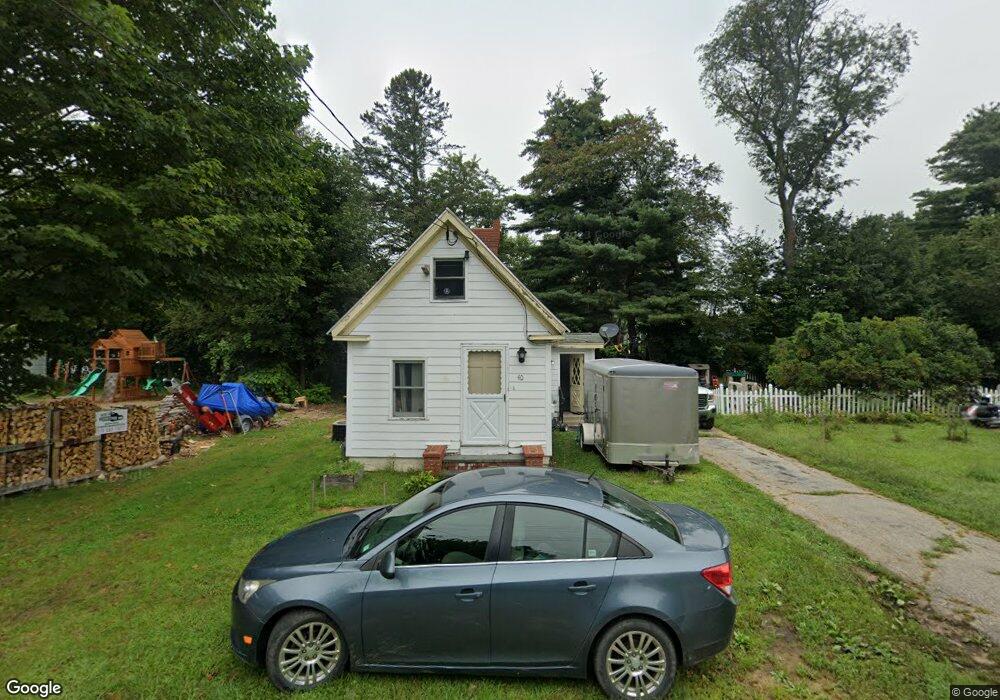
40 Joffre St Concord, NH 03301
South End NeighborhoodEstimated Value: $325,000 - $375,000
2
Beds
1
Bath
781
Sq Ft
$450/Sq Ft
Est. Value
About This Home
This home is located at 40 Joffre St, Concord, NH 03301 and is currently estimated at $351,417, approximately $449 per square foot. 40 Joffre St is a home located in Merrimack County with nearby schools including Abbot-Downing School, Rundlett Middle School, and Concord High School.
Ownership History
Date
Name
Owned For
Owner Type
Purchase Details
Closed on
Sep 15, 2021
Sold by
Humphreys Jo A and Humphreys Paul
Bought by
Finch Michael J
Current Estimated Value
Home Financials for this Owner
Home Financials are based on the most recent Mortgage that was taken out on this home.
Original Mortgage
$200,000
Outstanding Balance
$181,713
Interest Rate
2.7%
Mortgage Type
Purchase Money Mortgage
Estimated Equity
$169,704
Create a Home Valuation Report for This Property
The Home Valuation Report is an in-depth analysis detailing your home's value as well as a comparison with similar homes in the area
Home Values in the Area
Average Home Value in this Area
Purchase History
| Date | Buyer | Sale Price | Title Company |
|---|---|---|---|
| Finch Michael J | $220,000 | None Available |
Source: Public Records
Mortgage History
| Date | Status | Borrower | Loan Amount |
|---|---|---|---|
| Open | Finch Michael J | $200,000 |
Source: Public Records
Tax History Compared to Growth
Tax History
| Year | Tax Paid | Tax Assessment Tax Assessment Total Assessment is a certain percentage of the fair market value that is determined by local assessors to be the total taxable value of land and additions on the property. | Land | Improvement |
|---|---|---|---|---|
| 2024 | $5,527 | $199,600 | $102,600 | $97,000 |
| 2023 | $5,361 | $199,600 | $102,600 | $97,000 |
| 2022 | $5,168 | $199,600 | $102,600 | $97,000 |
| 2021 | $4,770 | $189,900 | $102,600 | $87,300 |
| 2020 | $4,509 | $168,500 | $85,700 | $82,800 |
| 2019 | $4,236 | $152,500 | $84,400 | $68,100 |
| 2018 | $4,088 | $145,000 | $81,000 | $64,000 |
| 2017 | $3,939 | $139,500 | $79,600 | $59,900 |
| 2016 | $3,752 | $135,600 | $79,600 | $56,000 |
| 2015 | $3,472 | $127,000 | $72,300 | $54,700 |
| 2014 | $3,405 | $127,000 | $72,300 | $54,700 |
| 2013 | $3,236 | $126,500 | $72,300 | $54,200 |
| 2012 | $3,197 | $131,200 | $72,300 | $58,900 |
Source: Public Records
Map
Nearby Homes