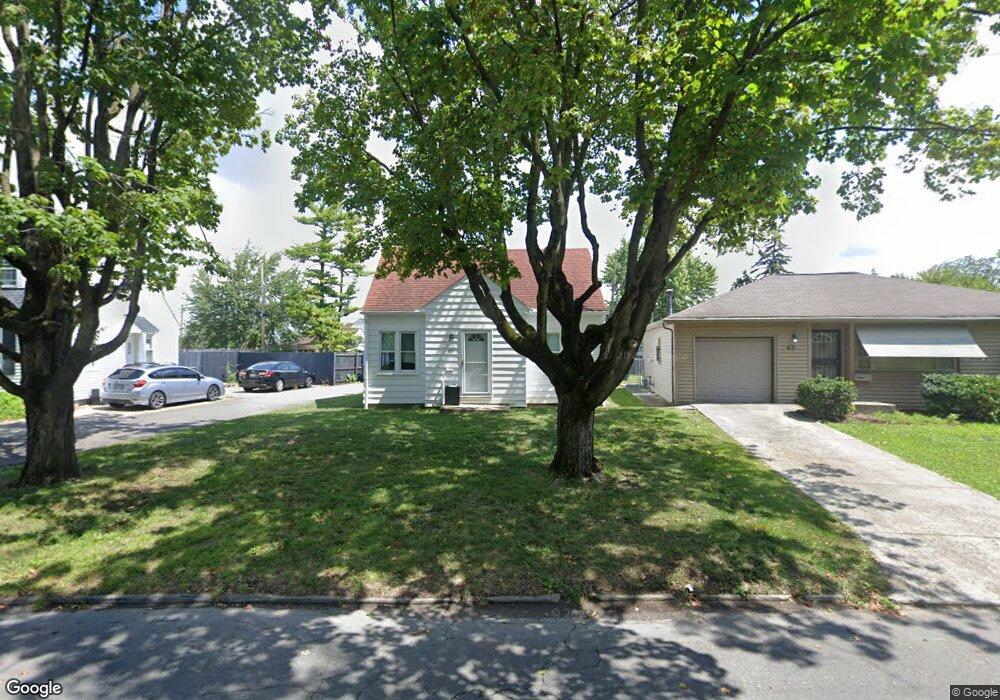
40 Letchworth Ave Columbus, OH 43204
Westgate NeighborhoodEstimated Value: $180,000 - $296,926
3
Beds
3
Baths
1,314
Sq Ft
$193/Sq Ft
Est. Value
About This Home
This home is located at 40 Letchworth Ave, Columbus, OH 43204 and is currently estimated at $253,982, approximately $193 per square foot. 40 Letchworth Ave is a home located in Franklin County with nearby schools including Westgate Alternative Elementary School, Westmoor Middle School, and West High School.
Ownership History
Date
Name
Owned For
Owner Type
Purchase Details
Closed on
May 8, 2023
Sold by
Moore Cinda L
Bought by
Condon Robert
Current Estimated Value
Home Financials for this Owner
Home Financials are based on the most recent Mortgage that was taken out on this home.
Original Mortgage
$161,397
Outstanding Balance
$156,852
Interest Rate
6.32%
Mortgage Type
VA
Estimated Equity
$97,130
Purchase Details
Closed on
Apr 19, 2023
Sold by
Moore Cinda L
Bought by
Condon Robert
Home Financials for this Owner
Home Financials are based on the most recent Mortgage that was taken out on this home.
Original Mortgage
$161,397
Outstanding Balance
$156,852
Interest Rate
6.32%
Mortgage Type
VA
Estimated Equity
$97,130
Purchase Details
Closed on
Mar 9, 1998
Sold by
Bible David A and Vollmuth Jolie A
Bought by
Moore John B
Purchase Details
Closed on
Mar 6, 1996
Sold by
Gault James W
Bought by
David A & Julie A Bible
Home Financials for this Owner
Home Financials are based on the most recent Mortgage that was taken out on this home.
Original Mortgage
$67,331
Interest Rate
7.05%
Mortgage Type
FHA
Create a Home Valuation Report for This Property
The Home Valuation Report is an in-depth analysis detailing your home's value as well as a comparison with similar homes in the area
Home Values in the Area
Average Home Value in this Area
Purchase History
| Date | Buyer | Sale Price | Title Company |
|---|---|---|---|
| Condon Robert | $160,000 | First American Title Insurance | |
| Condon Robert | $160,000 | First American Title Insurance | |
| Moore John B | $86,900 | -- | |
| David A & Julie A Bible | $67,500 | -- |
Source: Public Records
Mortgage History
| Date | Status | Borrower | Loan Amount |
|---|---|---|---|
| Open | Condon Robert | $161,397 | |
| Closed | Condon Robert | $161,397 | |
| Previous Owner | David A & Julie A Bible | $67,331 |
Source: Public Records
Tax History Compared to Growth
Tax History
| Year | Tax Paid | Tax Assessment Tax Assessment Total Assessment is a certain percentage of the fair market value that is determined by local assessors to be the total taxable value of land and additions on the property. | Land | Improvement |
|---|---|---|---|---|
| 2024 | $3,064 | $67,070 | $22,090 | $44,980 |
| 2023 | $3,081 | $67,070 | $22,090 | $44,980 |
| 2022 | $2,195 | $42,320 | $8,330 | $33,990 |
| 2021 | $2,199 | $42,320 | $8,330 | $33,990 |
| 2020 | $2,202 | $42,320 | $8,330 | $33,990 |
| 2019 | $2,143 | $35,320 | $6,930 | $28,390 |
| 2018 | $1,970 | $35,320 | $6,930 | $28,390 |
| 2017 | $2,063 | $35,320 | $6,930 | $28,390 |
| 2016 | $1,985 | $29,960 | $7,910 | $22,050 |
| 2015 | $1,802 | $29,960 | $7,910 | $22,050 |
| 2014 | $1,806 | $29,960 | $7,910 | $22,050 |
| 2013 | $938 | $31,535 | $8,330 | $23,205 |
Source: Public Records
Map
Nearby Homes
- 79 S Southampton Ave
- 43 Letchworth Ave
- 30 Demorest Rd
- 195 S Sylvan Ave
- 32 Orel Ave
- 36-38 Orel Ave
- 133 S Brinker Ave
- 253 Powhatan Ave
- 3096 Ellis Place
- 66 N Brinker Ave
- 160 N Sylvan Ave
- 113 N Brinker Ave Unit 115
- 328 S Southampton Ave
- 180 N Sylvan Ave
- 0 S Brinker Ave
- 119 N Westgate Ave
- 56 Broadlawn Ave
- 267 S Westgate Ave
- 3100 Steele Ave
- 75 N Huron Ave
- 32 Letchworth Ave
- 46 Letchworth Ave
- 28 Letchworth Ave
- 52 Letchworth Ave
- 47 S Southampton Ave
- 60 Letchworth Ave
- 37 Letchworth Ave
- 39 S Southampton Ave
- 51 Letchworth Ave
- 31 S Southampton Ave
- 27 Letchworth Ave
- 25 S Southampton Ave
- 51 S Southampton Ave
- 66 Letchworth Ave
- 57 S Southampton Ave
- 57 Letchworth Ave
- 3333 W Broad St Unit Apartment 19
- 3333 W Broad St
- 3341 W Broad St
- 65 Letchworth Ave