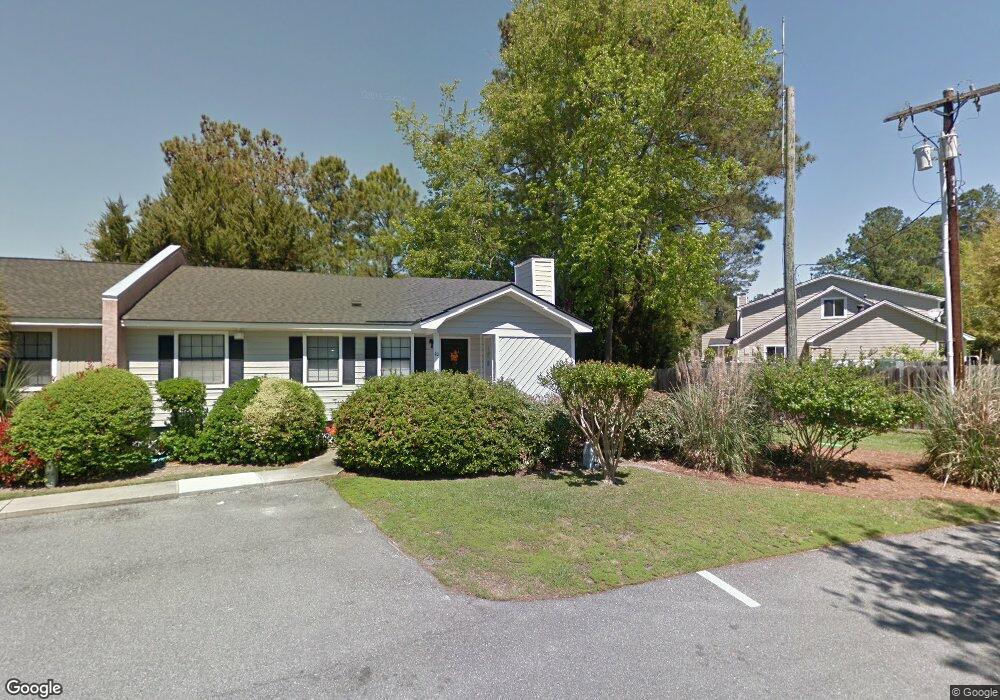
40 Navigator Ln Savannah, GA 31410
Estimated Value: $294,000 - $358,000
2
Beds
2
Baths
1,000
Sq Ft
$321/Sq Ft
Est. Value
About This Home
This home is located at 40 Navigator Ln, Savannah, GA 31410 and is currently estimated at $320,597, approximately $320 per square foot. 40 Navigator Ln is a home located in Chatham County with nearby schools including Marshpoint Elementary School, Coastal Middle School, and Islands High School.
Ownership History
Date
Name
Owned For
Owner Type
Purchase Details
Closed on
Oct 5, 2018
Sold by
Beasley Stacy
Bought by
Beasley Stacy and Beasley Charles Robert
Current Estimated Value
Purchase Details
Closed on
Oct 1, 2018
Sold by
Plooy Nico F Du
Bought by
Beasley Stacy
Purchase Details
Closed on
Feb 3, 2017
Sold by
Bailey Martha A
Bought by
Du Plooy Nico F and Du Plooy Suzanne T
Home Financials for this Owner
Home Financials are based on the most recent Mortgage that was taken out on this home.
Original Mortgage
$140,600
Interest Rate
4.2%
Mortgage Type
New Conventional
Create a Home Valuation Report for This Property
The Home Valuation Report is an in-depth analysis detailing your home's value as well as a comparison with similar homes in the area
Home Values in the Area
Average Home Value in this Area
Purchase History
| Date | Buyer | Sale Price | Title Company |
|---|---|---|---|
| Beasley Stacy | -- | -- | |
| Beasley Stacy | $158,000 | -- | |
| Du Plooy Nico F | $148,000 | -- |
Source: Public Records
Mortgage History
| Date | Status | Borrower | Loan Amount |
|---|---|---|---|
| Previous Owner | Du Plooy Nico F | $140,600 |
Source: Public Records
Tax History Compared to Growth
Tax History
| Year | Tax Paid | Tax Assessment Tax Assessment Total Assessment is a certain percentage of the fair market value that is determined by local assessors to be the total taxable value of land and additions on the property. | Land | Improvement |
|---|---|---|---|---|
| 2025 | $7,066 | $104,240 | $37,520 | $66,720 |
| 2024 | $7,066 | $105,280 | $37,520 | $67,760 |
| 2023 | $4,522 | $90,560 | $25,000 | $65,560 |
| 2022 | $2,743 | $87,200 | $12,560 | $74,640 |
| 2021 | $2,823 | $77,000 | $12,560 | $64,440 |
| 2020 | $2,306 | $71,000 | $12,560 | $58,440 |
| 2019 | $3,388 | $63,200 | $11,566 | $51,634 |
| 2018 | $2,165 | $59,200 | $11,781 | $47,419 |
| 2017 | $1,643 | $47,880 | $12,560 | $35,320 |
| 2016 | $1,520 | $45,640 | $12,560 | $33,080 |
| 2015 | $1,576 | $47,240 | $12,560 | $34,680 |
| 2014 | $2,629 | $53,120 | $0 | $0 |
Source: Public Records
Map
Nearby Homes
- 39 Helmsman Ct
- 6 Sapelo Rd
- 5 Ossabaw Rd
- 0 Johnny Mercer Blvd Unit 322107
- 11 Ossabaw Rd
- 5 Port Royal Dr
- 118 Wassaw Rd
- 103 Wassaw Rd
- 113 Wassaw Rd
- 128 Wassaw Rd
- 123 Wassaw Rd
- 302 Larbre Rd
- 73 Hutchins Ln
- 322 Suncrest Blvd
- 104 Saint Andrews Way
- 7010 Johnny Mercer Blvd
- 22 Dockside Dr
- 401 N Cromwell Rd Unit Q7
- 401 N Cromwell Rd Unit 2Q
- 401 N Cromwell Rd Unit F6
- 41 Navigator Ln
- 34 Navigator Ln
- 33 Navigator Ln
- 42 Navigator Ln
- 70 Navigator Ln
- 32 Navigator Ln
- 69 Navigator Ln
- 43 Navigator Ln
- 71 Navigator Ln
- 31 Navigator Ln
- 26 Navigator Ln
- 68 Navigator Ln
- 30 Navigator Ln
- 25 Navigator Ln
- 44 Navigator Ln
- 29 Navigator Ln
- 64 Navigator Ln
- 20 Navigator Ln
- 65 Navigator Ln
- 24 Navigator Ln