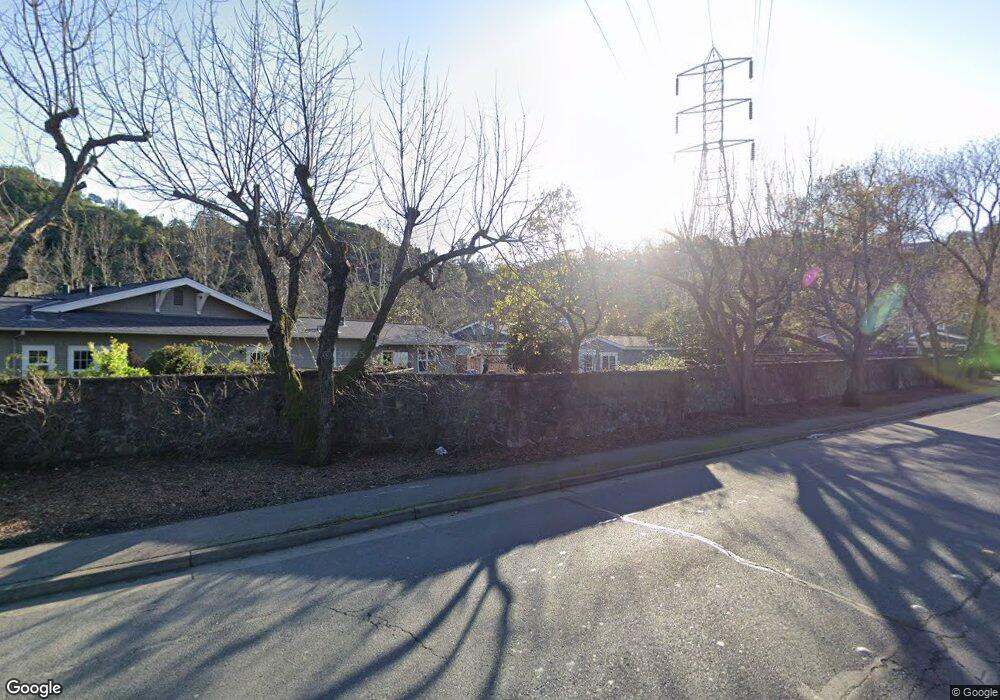
40 Olympic Oaks Dr Lafayette, CA 94549
Rossmoor NeighborhoodEstimated Value: $1,990,482 - $2,433,000
3
Beds
3
Baths
2,343
Sq Ft
$950/Sq Ft
Est. Value
About This Home
This home is located at 40 Olympic Oaks Dr, Lafayette, CA 94549 and is currently estimated at $2,226,121, approximately $950 per square foot. 40 Olympic Oaks Dr is a home located in Contra Costa County with nearby schools including Burton Valley Elementary School, M.H. Stanley Middle School, and Acalanes High School.
Ownership History
Date
Name
Owned For
Owner Type
Purchase Details
Closed on
May 28, 2015
Sold by
Riley Sean and Riley Erin
Bought by
Riley Family Trust
Current Estimated Value
Purchase Details
Closed on
Mar 20, 2008
Sold by
Kleinerman David and Kleinerman Miriam
Bought by
Riley Sean C and Riley Erin W
Home Financials for this Owner
Home Financials are based on the most recent Mortgage that was taken out on this home.
Original Mortgage
$609,000
Outstanding Balance
$394,603
Interest Rate
6.5%
Mortgage Type
Purchase Money Mortgage
Estimated Equity
$1,831,518
Purchase Details
Closed on
Apr 21, 1998
Sold by
J S French Construction Inc
Bought by
Kleinerman David and Kleinerman Miriam
Home Financials for this Owner
Home Financials are based on the most recent Mortgage that was taken out on this home.
Original Mortgage
$408,000
Interest Rate
7.06%
Mortgage Type
Purchase Money Mortgage
Purchase Details
Closed on
Sep 15, 1997
Sold by
Gordon French Dev Co
Bought by
J S French Construction
Home Financials for this Owner
Home Financials are based on the most recent Mortgage that was taken out on this home.
Original Mortgage
$1,479,060
Interest Rate
7.45%
Mortgage Type
Construction
Create a Home Valuation Report for This Property
The Home Valuation Report is an in-depth analysis detailing your home's value as well as a comparison with similar homes in the area
Home Values in the Area
Average Home Value in this Area
Purchase History
We collect this data history from publicly available records. To have your information removed, we recommend requesting removal directly through your county’s website.
| Date | Buyer | Sale Price | Title Company |
|---|---|---|---|
| Riley Family Trust | -- | None Available | |
| Riley Sean | -- | None Available | |
| Riley Sean C | $1,015,000 | First American Title Company | |
| Kleinerman David | $510,000 | Old Republic Title Company | |
| J S French Construction | $680,000 | Old Republic Title Company |
Source: Public Records
Mortgage History
We collect this data history from publicly available records. To have your information removed, we recommend requesting removal directly through your county’s website.
| Date | Status | Borrower | Loan Amount |
|---|---|---|---|
| Open | Riley Sean C | $609,000 | |
| Previous Owner | Kleinerman David | $408,000 | |
| Previous Owner | J S French Construction | $1,479,060 | |
| Closed | Kleinerman David | $76,500 |
Source: Public Records
Tax History
| Year | Tax Paid | Tax Assessment Tax Assessment Total Assessment is a certain percentage of the fair market value that is determined by local assessors to be the total taxable value of land and additions on the property. | Land | Improvement |
|---|---|---|---|---|
| 2025 | $16,614 | $1,333,208 | $798,614 | $534,594 |
| 2024 | $16,046 | $1,307,067 | $782,955 | $524,112 |
| 2023 | $16,046 | $1,281,439 | $767,603 | $513,836 |
| 2022 | $15,800 | $1,256,313 | $752,552 | $503,761 |
| 2021 | $15,345 | $1,231,681 | $737,797 | $493,884 |
| 2019 | $14,943 | $1,195,150 | $715,914 | $479,236 |
| 2018 | $14,418 | $1,171,717 | $701,877 | $469,840 |
| 2017 | $14,172 | $1,148,743 | $688,115 | $460,628 |
| 2016 | $13,907 | $1,126,220 | $674,623 | $451,597 |
| 2015 | $13,530 | $1,109,304 | $664,490 | $444,814 |
| 2014 | -- | $1,087,575 | $651,474 | $436,101 |
Source: Public Records
Map
Nearby Homes
- 10 Diablo Oaks Way
- 53 Hidden Oaks Dr
- 304 Willoughby Ct
- 1300 Skycrest Dr Unit 2
- 1312 Skycrest Dr Unit 1
- 1232 Skycrest Dr Unit 2
- 959 Janet Ln
- 1201 Skycrest Dr Unit 2
- 1087 Rahara Dr A
- 22 the Nines
- 1026 Windsor Dr
- 2830 Kinney Dr
- 3241 Marlene Dr
- 3279 Mt Diablo Ct Unit 13
- 3279 Mt Diablo Ct Unit 31
- 3268 Marlene Dr Unit 12
- 3345 Ridge Rd
- 3350 Carlyle Terrace
- 3033 Golden Rain Rd Unit 4
- 3375 Freeman Rd
- 45 Olympic Oaks Dr
- 49 Olympic Oaks Dr
- 41 Olympic Oaks Dr
- 3238 Andreasen Dr
- 3223 Andreasen Dr
- 3227 Andreasen Dr
- 3219 Andreasen Dr
- 33 Olympic Oaks Dr
- 3235 Andreasen Dr
- 3215 Andreasen Dr
- 36 Olympic Oaks Dr
- 3244 Andreasen Dr
- 29 Olympic Oaks Dr
- 858 Reliez Station Rd
- 32 Olympic Oaks Dr
- 3213 Andreasen Dr
- 850 Reliez Station Rd
- 3209 Andreasen Dr
- 28 Olympic Oaks Dr
- 1 Roxanne Ln
Your Personal Tour Guide
Ask me questions while you tour the home.