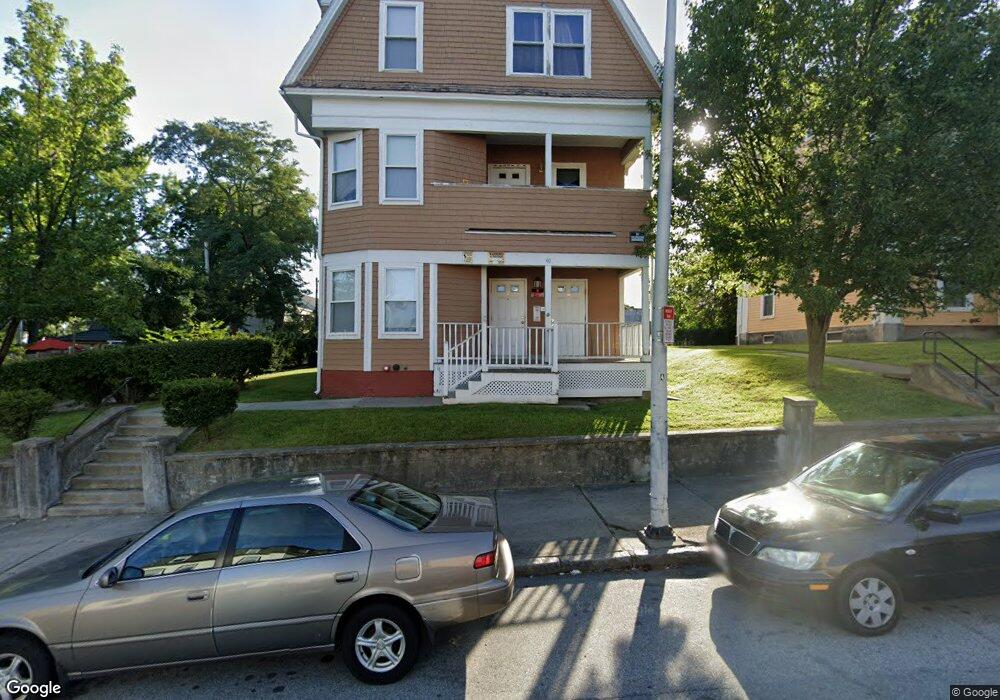
40 Oread St Worcester, MA 01608
Beacon Brightly NeighborhoodEstimated Value: $301,000 - $864,000
17
Beds
4
Baths
4,800
Sq Ft
$121/Sq Ft
Est. Value
About This Home
This home is located at 40 Oread St, Worcester, MA 01608 and is currently estimated at $582,500, approximately $121 per square foot. 40 Oread St is a home located in Worcester County with nearby schools including Jacob Hiatt Magnet School, Chandler Magnet, and Woodland Academy.
Ownership History
Date
Name
Owned For
Owner Type
Purchase Details
Closed on
Sep 17, 2018
Sold by
Beacon Oread Lp
Bought by
Main South Community D
Current Estimated Value
Home Financials for this Owner
Home Financials are based on the most recent Mortgage that was taken out on this home.
Original Mortgage
$941,000
Outstanding Balance
$820,683
Interest Rate
4.6%
Mortgage Type
Stand Alone Refi Refinance Of Original Loan
Estimated Equity
-$238,183
Purchase Details
Closed on
Dec 2, 1999
Sold by
Main S Comm Dev Corp
Bought by
Beacon Oread Lp
Purchase Details
Closed on
May 3, 1999
Sold by
Fnma
Bought by
Main So Community Dev
Purchase Details
Closed on
Apr 30, 1999
Sold by
Worster William H
Bought by
Federal National Mortgage Association
Create a Home Valuation Report for This Property
The Home Valuation Report is an in-depth analysis detailing your home's value as well as a comparison with similar homes in the area
Home Values in the Area
Average Home Value in this Area
Purchase History
| Date | Buyer | Sale Price | Title Company |
|---|---|---|---|
| Main South Community D | -- | -- | |
| Beacon Oread Lp | $69,521 | -- | |
| Main So Community Dev | $54,000 | -- | |
| Federal National Mortgage Association | $17,255 | -- |
Source: Public Records
Mortgage History
| Date | Status | Borrower | Loan Amount |
|---|---|---|---|
| Open | Main South Community D | $941,000 |
Source: Public Records
Tax History
| Year | Tax Paid | Tax Assessment Tax Assessment Total Assessment is a certain percentage of the fair market value that is determined by local assessors to be the total taxable value of land and additions on the property. | Land | Improvement |
|---|---|---|---|---|
| 2025 | $2,974 | $225,483 | $77,300 | $148,183 |
| 2024 | $2,837 | $206,349 | $77,300 | $129,049 |
| 2023 | $2,959 | $206,349 | $62,000 | $144,349 |
| 2022 | $3,047 | $200,339 | $49,600 | $150,739 |
| 2021 | $3,262 | $200,339 | $39,700 | $160,639 |
| 2020 | $5,479 | $322,300 | $39,800 | $282,500 |
| 2019 | $5,571 | $309,500 | $39,300 | $270,200 |
| 2018 | $5,473 | $289,400 | $39,300 | $250,100 |
| 2017 | $5,118 | $266,300 | $39,300 | $227,000 |
| 2016 | $5,006 | $242,900 | $31,800 | $211,100 |
| 2015 | $4,875 | $242,900 | $31,800 | $211,100 |
| 2014 | $4,746 | $242,900 | $31,800 | $211,100 |
Source: Public Records
Map
Nearby Homes
- 69 Oread St
- 12 King St
- 5 Ripley Place
- 2 Preston St
- 4 Preston St
- 709 Main St
- 15 Gardner St
- 35 May St
- 146 -152 Chandler
- 13 Sigel St
- 7 Bluff St
- 14 Hancock St
- 70 Southbridge St Unit 611
- 70 Southbridge St Unit 310
- 7 Wyman St
- 195 Millbury St
- 20 Washburn St
- 607 Cambridge St Unit 4
- 33 Florence St
- 531 Main St Unit 410
Your Personal Tour Guide
Ask me questions while you tour the home.