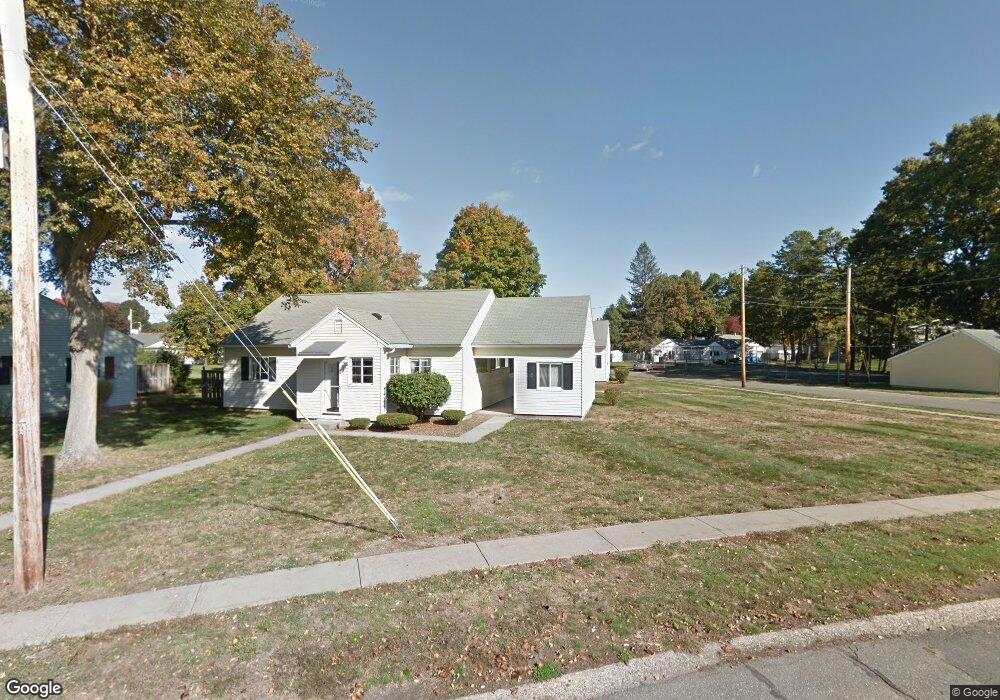
40 Pheasant Way Chicopee, MA 01022
Fairview NeighborhoodEstimated Value: $239,000 - $250,000
2
Beds
1
Bath
1,086
Sq Ft
$224/Sq Ft
Est. Value
About This Home
This home is located at 40 Pheasant Way, Chicopee, MA 01022 and is currently estimated at $243,554, approximately $224 per square foot. 40 Pheasant Way is a home located in Hampden County with nearby schools including Bowie Elementary School, Fairview Middle School, and Chicopee Comprehensive High School.
Ownership History
Date
Name
Owned For
Owner Type
Purchase Details
Closed on
Mar 11, 2025
Sold by
Durant Michaele A
Bought by
Clairmont Bryan L and Mckittrick Rebecca L
Current Estimated Value
Purchase Details
Closed on
Nov 28, 2023
Sold by
Warren Brandon A
Bought by
Durant Michaele A
Purchase Details
Closed on
Feb 27, 2017
Sold by
Fnma
Bought by
Warren Brandon A
Home Financials for this Owner
Home Financials are based on the most recent Mortgage that was taken out on this home.
Original Mortgage
$98,135
Interest Rate
4.12%
Mortgage Type
FHA
Purchase Details
Closed on
Jul 7, 2016
Sold by
Flamand Andrea G and Citizens Bank Na
Bought by
Federal National Mortgage Association
Purchase Details
Closed on
Jul 6, 2010
Sold by
Flamand Andrea G and Bazzano Andrea G
Bought by
Flamand Andrea G and Flamand Anthony J
Purchase Details
Closed on
Sep 17, 1985
Bought by
Flamand Andrea G and Flamand Anthony J
Create a Home Valuation Report for This Property
The Home Valuation Report is an in-depth analysis detailing your home's value as well as a comparison with similar homes in the area
Home Values in the Area
Average Home Value in this Area
Purchase History
| Date | Buyer | Sale Price | Title Company |
|---|---|---|---|
| Clairmont Bryan L | -- | None Available | |
| Clairmont Bryan L | -- | None Available | |
| Durant Michaele A | $240,000 | None Available | |
| Durant Michaele A | $240,000 | None Available | |
| Warren Brandon A | $95,000 | -- | |
| Warren Brandon A | $95,000 | -- | |
| Federal National Mortgage Association | $72,100 | -- | |
| Federal National Mortgage Association | $72,100 | -- | |
| Flamand Andrea G | -- | -- | |
| Flamand Andrea G | -- | -- | |
| Flamand Andrea G | -- | -- |
Source: Public Records
Mortgage History
| Date | Status | Borrower | Loan Amount |
|---|---|---|---|
| Previous Owner | Warren Brandon A | $98,135 | |
| Previous Owner | Flamand Andrea G | $103,000 | |
| Previous Owner | Flamand Andrea G | $66,000 |
Source: Public Records
Tax History
| Year | Tax Paid | Tax Assessment Tax Assessment Total Assessment is a certain percentage of the fair market value that is determined by local assessors to be the total taxable value of land and additions on the property. | Land | Improvement |
|---|---|---|---|---|
| 2025 | $3,208 | $211,600 | $0 | $211,600 |
| 2024 | $2,598 | $176,000 | $0 | $176,000 |
| 2023 | $2,442 | $161,200 | $0 | $161,200 |
| 2022 | $2,295 | $135,100 | $0 | $135,100 |
| 2021 | $2,192 | $124,500 | $0 | $124,500 |
| 2020 | $1,957 | $112,100 | $0 | $112,100 |
| 2019 | $1,927 | $107,300 | $0 | $107,300 |
| 2018 | $1,879 | $102,600 | $0 | $102,600 |
| 2017 | $1,776 | $102,600 | $0 | $102,600 |
| 2016 | $1,759 | $104,000 | $0 | $104,000 |
| 2015 | $1,824 | $104,000 | $0 | $104,000 |
| 2014 | $912 | $104,000 | $0 | $104,000 |
Source: Public Records
Map
Nearby Homes
- 38 Applewood Dr
- 37 Greenwood Terrace
- 70 Greenwood Terrace
- 58 Robinridge Rd
- 210 Johnson Rd Unit 23
- 104 Johnson Rd Unit 1103
- 104 Johnson Rd Unit 707
- 52 Falmouth Rd
- 1697 Westover Rd
- 111 Festival Cir
- 67 Streiber Dr
- 119 Oakridge St
- 460 Irene St
- 81 Mccarthy Ave
- 117 Andersen Rd
- 1153 James St
- 1181 James St
- 130 Celebration Cir
- 83 Old Farm Rd
- 103 Lauzier Terrace
- 40 Pheasant Way Unit 40
- 38 Pheasant Way
- 65 Doverbrook Rd
- 67 Doverbrook Rd
- 71 Doverbrook Rd
- 32 Pheasant Way
- 28 Pheasant Way
- 32 Pheasant Way Unit 6081B
- 24 Pheasant Way
- 61 Doverbrook Rd
- 39 Pheasant Way
- 39 Pheasant Way Unit 39
- 39 Pheasant Way Unit 6068B
- 22 Pheasant Way
- 33 Pheasant Way
- 33 Pheasant Way Unit 33
- 35 Doverbrook Rd
- 43 Doverbrook Rd
- 45 Doverbrook Rd
- 51 Doverbrook Rd
Your Personal Tour Guide
Ask me questions while you tour the home.