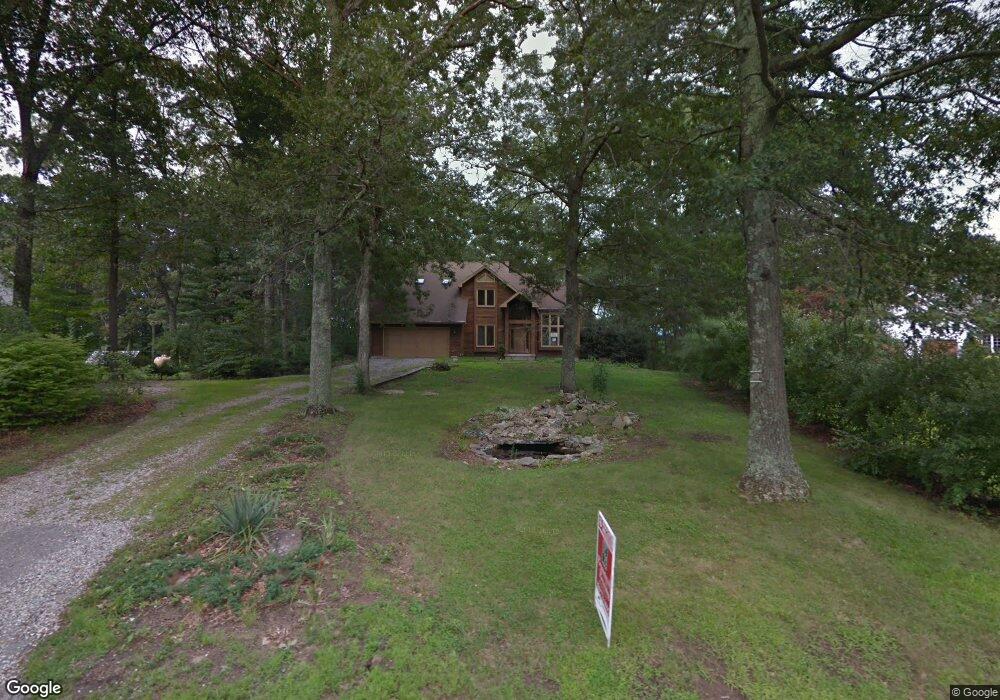
40 Stanley Rd Windham, CT 06280
Estimated Value: $381,000 - $411,000
3
Beds
2
Baths
1,908
Sq Ft
$206/Sq Ft
Est. Value
About This Home
This home is located at 40 Stanley Rd, Windham, CT 06280 and is currently estimated at $392,747, approximately $205 per square foot. 40 Stanley Rd is a home located in Windham County with nearby schools including Windham Middle School, Windham High School, and St Mary St Joseph School.
Ownership History
Date
Name
Owned For
Owner Type
Purchase Details
Closed on
Dec 21, 2011
Sold by
Fhlmc
Bought by
Puccia Angela
Current Estimated Value
Home Financials for this Owner
Home Financials are based on the most recent Mortgage that was taken out on this home.
Original Mortgage
$158,769
Outstanding Balance
$106,911
Interest Rate
3.99%
Mortgage Type
Purchase Money Mortgage
Estimated Equity
$285,836
Purchase Details
Closed on
Sep 24, 2010
Sold by
Jp Morgan Chase Bk
Bought by
Fhlmc
Purchase Details
Closed on
Aug 11, 2010
Sold by
Campanele Francis
Bought by
Jp Morgan Chase Bk
Purchase Details
Closed on
Nov 23, 2005
Sold by
Gervais Marilyn A and Wheeler Judith A
Bought by
Campanele Francis
Home Financials for this Owner
Home Financials are based on the most recent Mortgage that was taken out on this home.
Original Mortgage
$150,000
Interest Rate
6.36%
Create a Home Valuation Report for This Property
The Home Valuation Report is an in-depth analysis detailing your home's value as well as a comparison with similar homes in the area
Home Values in the Area
Average Home Value in this Area
Purchase History
| Date | Buyer | Sale Price | Title Company |
|---|---|---|---|
| Puccia Angela | $162,900 | -- | |
| Fhlmc | -- | -- | |
| Jp Morgan Chase Bk | -- | -- | |
| Campanele Francis | $325,000 | -- |
Source: Public Records
Mortgage History
| Date | Status | Borrower | Loan Amount |
|---|---|---|---|
| Open | Campanele Francis | $158,769 | |
| Previous Owner | Campanele Francis | $88,600 | |
| Previous Owner | Campanele Francis | $150,000 | |
| Previous Owner | Campanele Francis | $225,000 |
Source: Public Records
Tax History
| Year | Tax Paid | Tax Assessment Tax Assessment Total Assessment is a certain percentage of the fair market value that is determined by local assessors to be the total taxable value of land and additions on the property. | Land | Improvement |
|---|---|---|---|---|
| 2025 | $8,289 | $277,680 | $35,970 | $241,710 |
| 2024 | $8,300 | $277,680 | $35,970 | $241,710 |
| 2023 | $6,275 | $161,680 | $31,280 | $130,400 |
| 2022 | $6,113 | $161,680 | $31,280 | $130,400 |
| 2021 | $6,372 | $161,680 | $31,280 | $130,400 |
| 2020 | $6,289 | $161,680 | $31,280 | $130,400 |
| 2019 | $6,209 | $161,680 | $31,280 | $130,400 |
| 2017 | $5,861 | $152,120 | $31,170 | $120,950 |
| 2015 | $5,508 | $152,120 | $31,170 | $120,950 |
| 2014 | $5,213 | $152,120 | $31,170 | $120,950 |
Source: Public Records
Map
Nearby Homes
- 253 Brick Top Rd
- 11 Woodland Dr
- 34 N Windham Rd
- 248 Tuckie Rd
- 15 Cracow Ave
- 80 Old Plains Rd
- 39 S Windham Rd
- 363 Windham Rd
- 96 Mcdermott Ave
- 38 Elm St
- 50 Selden St
- 6 Skyline Dr
- 57 Chapman St
- 39 Pleasant View Ave
- 119 Quercus Ave
- 26 Maple Ave
- 235 S Windham Rd
- 366 Ash St Unit 12
- 50 South St
- 5 Woods Way Unit WOOD005
Your Personal Tour Guide
Ask me questions while you tour the home.