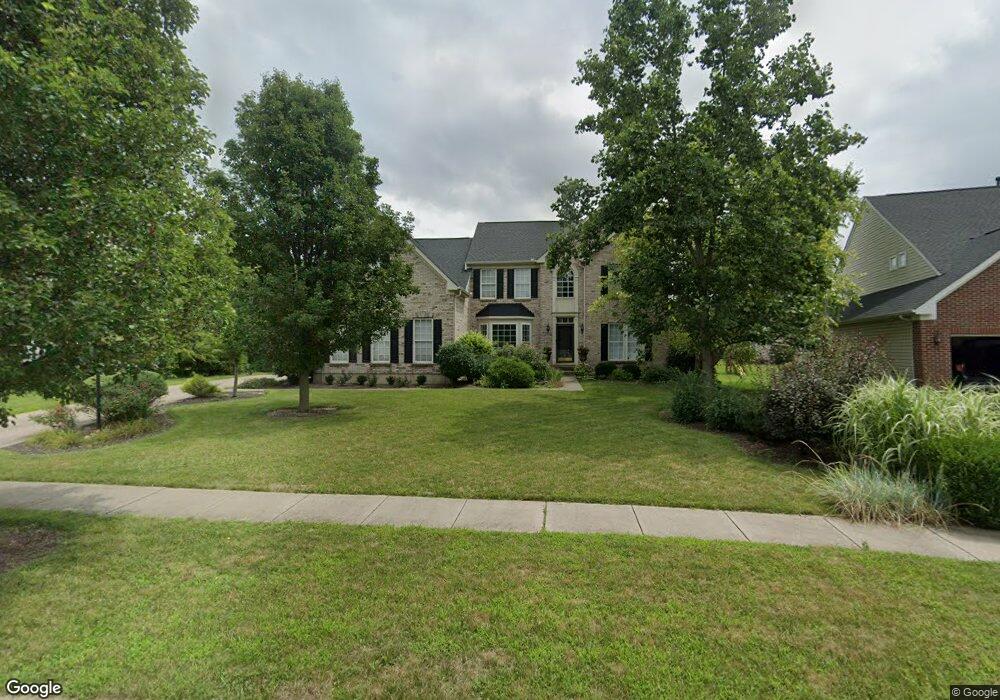
40 Stanton Dr Springboro, OH 45066
Estimated Value: $558,069 - $597,000
4
Beds
3
Baths
3,632
Sq Ft
$160/Sq Ft
Est. Value
About This Home
This home is located at 40 Stanton Dr, Springboro, OH 45066 and is currently estimated at $579,517, approximately $159 per square foot. 40 Stanton Dr is a home located in Warren County with nearby schools including Clearcreek Elementary School, Springboro Intermediate School, and Springboro Junior High School.
Ownership History
Date
Name
Owned For
Owner Type
Purchase Details
Closed on
Apr 26, 2011
Sold by
Federal Home Loan Mortgage Corporation
Bought by
Richardson Randy M and Richardson Meghan S
Current Estimated Value
Home Financials for this Owner
Home Financials are based on the most recent Mortgage that was taken out on this home.
Original Mortgage
$208,000
Outstanding Balance
$141,962
Interest Rate
4.88%
Mortgage Type
Purchase Money Mortgage
Estimated Equity
$437,555
Purchase Details
Closed on
Aug 9, 2010
Sold by
Hecht Mark C
Bought by
Federal Home Loan Mortgage Corp
Purchase Details
Closed on
Dec 12, 2003
Sold by
Nvr Inc
Bought by
Hecht Mark C and Hecht Julie A
Home Financials for this Owner
Home Financials are based on the most recent Mortgage that was taken out on this home.
Original Mortgage
$264,041
Interest Rate
5.84%
Mortgage Type
Purchase Money Mortgage
Purchase Details
Closed on
Sep 4, 2003
Sold by
Coffman Development Co Inc
Bought by
Nvr Inc
Create a Home Valuation Report for This Property
The Home Valuation Report is an in-depth analysis detailing your home's value as well as a comparison with similar homes in the area
Home Values in the Area
Average Home Value in this Area
Purchase History
| Date | Buyer | Sale Price | Title Company |
|---|---|---|---|
| Richardson Randy M | $260,000 | Attorney | |
| Federal Home Loan Mortgage Corp | $230,000 | None Available | |
| Hecht Mark C | $330,066 | -- | |
| Nvr Inc | $158,700 | First Title Agency Inc |
Source: Public Records
Mortgage History
| Date | Status | Borrower | Loan Amount |
|---|---|---|---|
| Open | Richardson Randy M | $208,000 | |
| Previous Owner | Hecht Mark C | $264,041 |
Source: Public Records
Tax History
| Year | Tax Paid | Tax Assessment Tax Assessment Total Assessment is a certain percentage of the fair market value that is determined by local assessors to be the total taxable value of land and additions on the property. | Land | Improvement |
|---|---|---|---|---|
| 2025 | $6,639 | $170,020 | $38,500 | $131,520 |
| 2024 | $6,639 | $170,020 | $38,500 | $131,520 |
| 2023 | $5,633 | $132,289 | $20,650 | $111,639 |
| 2022 | $5,550 | $132,290 | $20,650 | $111,640 |
| 2021 | $5,165 | $132,290 | $20,650 | $111,640 |
| 2020 | $5,007 | $112,109 | $17,500 | $94,609 |
| 2019 | $4,617 | $112,109 | $17,500 | $94,609 |
| 2018 | $4,620 | $112,109 | $17,500 | $94,609 |
| 2017 | $4,733 | $103,464 | $16,079 | $87,385 |
| 2016 | $4,937 | $103,464 | $16,079 | $87,385 |
| 2015 | $4,748 | $103,464 | $16,079 | $87,385 |
| 2014 | $4,748 | $94,060 | $14,620 | $79,440 |
| 2013 | $4,744 | $112,620 | $17,500 | $95,120 |
Source: Public Records
Map
Nearby Homes
- 250 Ballard Dr
- 80 Gregg Ct
- 25 Glass Ct
- 195 Oasis Ct
- 123 Rippling Brook Ln
- 85 Meadows Dr
- 136 Waterhaven Way
- 10084 Gully Pass Dr Unit 248
- 10084 Gully Pass Dr
- 10213 Gully Pass Dr Unit 251
- 10109 Gully Pass Dr Unit 250
- 160 Old Pond Rd
- 44 Old Pond Rd
- 108 Old Pond Rd
- 10152 Gully Pass Dr
- 2002 Glen Valley Dr
- 6 Waterlily Dr
- 2005 Glen Valley Dr Unit 210
- 2005 Glen Valley Dr
- 92 Villa Pointe Dr Unit 92
- 36 Stanton Dr
- 44 Stanton Dr
- 32 Stanton Dr
- 70 Clearsprings Dr
- 35 Willow Grove Dr
- 48 Stanton Dr
- 45 Willow Grove Dr
- 55 Willow Grove Dr
- 60 Clearsprings Dr
- 45 Stanton Dr
- 28 Stanton Dr
- 75 Willow Grove Dr
- 39 Stanton Dr
- 52 Stanton Dr
- 51 Stanton Dr
- 50 Clearsprings Dr
- 95 Willow Grove Dr
- 33 Stanton Dr
- 24 Stanton Dr
- 30 Willow Grove Dr
Your Personal Tour Guide
Ask me questions while you tour the home.