Estimated Value: $817,000 - $971,000
4
Beds
3
Baths
2,868
Sq Ft
$310/Sq Ft
Est. Value
About This Home
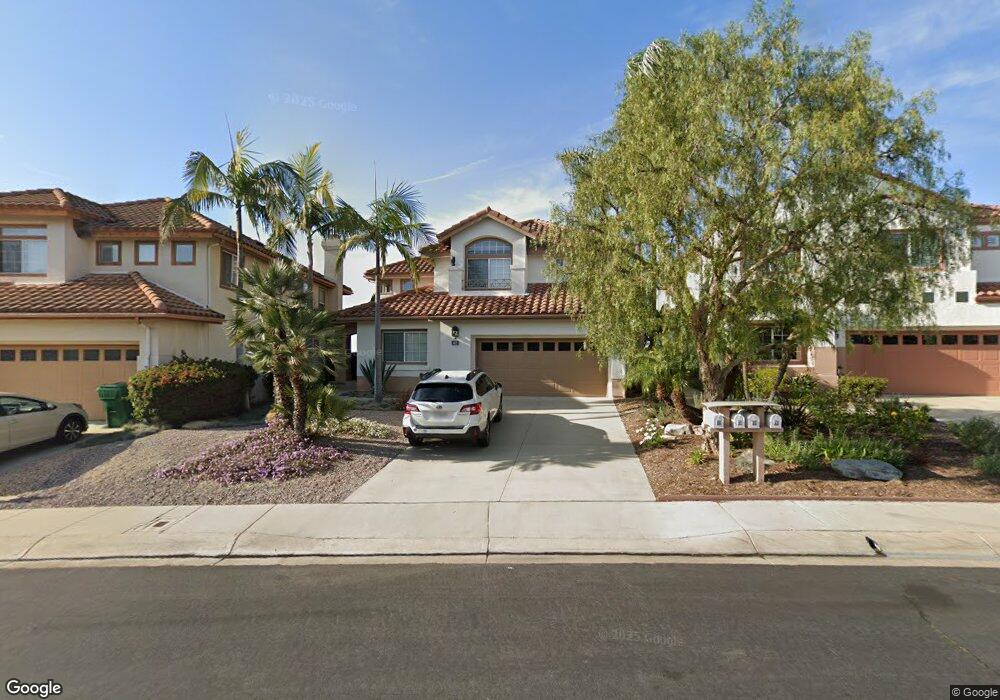
This home is located at 40 Urey Ct, Irvine, CA 92617 and is currently estimated at $889,701, approximately $310 per square foot. 40 Urey Ct is a home located in Orange County with nearby schools including Turtle Rock Elementary, Rancho San Joaquin Middle School, and University High School.
Ownership History
Date
Name
Owned For
Owner Type
Purchase Details
Closed on
Oct 28, 2016
Sold by
Foreman Matthew D
Bought by
Foreman Matthew D and The Matthew D Foreman Living Trust
Current Estimated Value
Home Financials for this Owner
Home Financials are based on the most recent Mortgage that was taken out on this home.
Original Mortgage
$341,100
Interest Rate
2.78%
Purchase Details
Closed on
Jun 26, 2014
Sold by
Foreman Matthew
Bought by
Foreman Matthew D and Matthew D Foreman Living Trust
Purchase Details
Closed on
Dec 9, 2013
Sold by
Foreman Matthew Dean and Foreman Matthew
Bought by
Foreman Matthew Dean
Home Financials for this Owner
Home Financials are based on the most recent Mortgage that was taken out on this home.
Original Mortgage
$417,000
Interest Rate
4.13%
Mortgage Type
New Conventional
Create a Home Valuation Report for This Property
The Home Valuation Report is an in-depth analysis detailing your home's value as well as a comparison with similar homes in the area
Home Values in the Area
Average Home Value in this Area
Purchase History
| Date | Buyer | Sale Price | Title Company |
|---|---|---|---|
| Foreman Matthew D | -- | Accommodation | |
| Foreman Matthew D | -- | California Title Company | |
| Foreman Matthew D | -- | None Available | |
| Foreman Matthew Dean | -- | California Title Company |
Source: Public Records
Mortgage History
| Date | Status | Borrower | Loan Amount |
|---|---|---|---|
| Closed | Foreman Matthew D | $341,100 | |
| Closed | Foreman Matthew Dean | $417,000 |
Source: Public Records
Tax History
| Year | Tax Paid | Tax Assessment Tax Assessment Total Assessment is a certain percentage of the fair market value that is determined by local assessors to be the total taxable value of land and additions on the property. | Land | Improvement |
|---|---|---|---|---|
| 2025 | $7,069 | $690,001 | $199,376 | $490,625 |
| 2024 | $7,069 | $676,472 | $195,467 | $481,005 |
| 2023 | $6,886 | $663,208 | $191,634 | $471,574 |
| 2022 | $6,761 | $650,204 | $187,876 | $462,328 |
| 2021 | $6,609 | $637,455 | $184,192 | $453,263 |
| 2020 | $6,571 | $630,919 | $182,303 | $448,616 |
| 2019 | $6,425 | $618,549 | $178,729 | $439,820 |
| 2018 | $6,309 | $606,421 | $175,224 | $431,197 |
| 2017 | $6,178 | $594,531 | $171,788 | $422,743 |
| 2016 | $5,900 | $582,874 | $168,420 | $414,454 |
| 2015 | $5,614 | $554,470 | $22,470 | $532,000 |
| 2014 | $5,561 | $549,333 | $15,355 | $533,978 |
Source: Public Records
Map
Nearby Homes
- 19421 Sierra Lago Rd
- 234 Lonetree
- 6 Cavaillon
- 17 Dartmouth
- 24 Marble Sands
- 22 Exeter Unit 23
- 17 Lemans
- 27 Rose Trellis
- 18862 Via Palatino
- 18802 Saginaw Dr
- 72 Vassar Aisle
- 26 Georgetown
- 9 Winthrop
- 12 Arborside
- 31 Saint Tropez
- 20 Blue Summit
- 1 Harcourt
- 22 Arborside Unit 11
- 18751 Via San Marco
- 2030 Port Weybridge Place
Your Personal Tour Guide
Ask me questions while you tour the home.