40 Wheeler Irvine, CA 92620
Northwood NeighborhoodEstimated Value: $1,831,641 - $1,907,000
3
Beds
3
Baths
2,211
Sq Ft
$843/Sq Ft
Est. Value
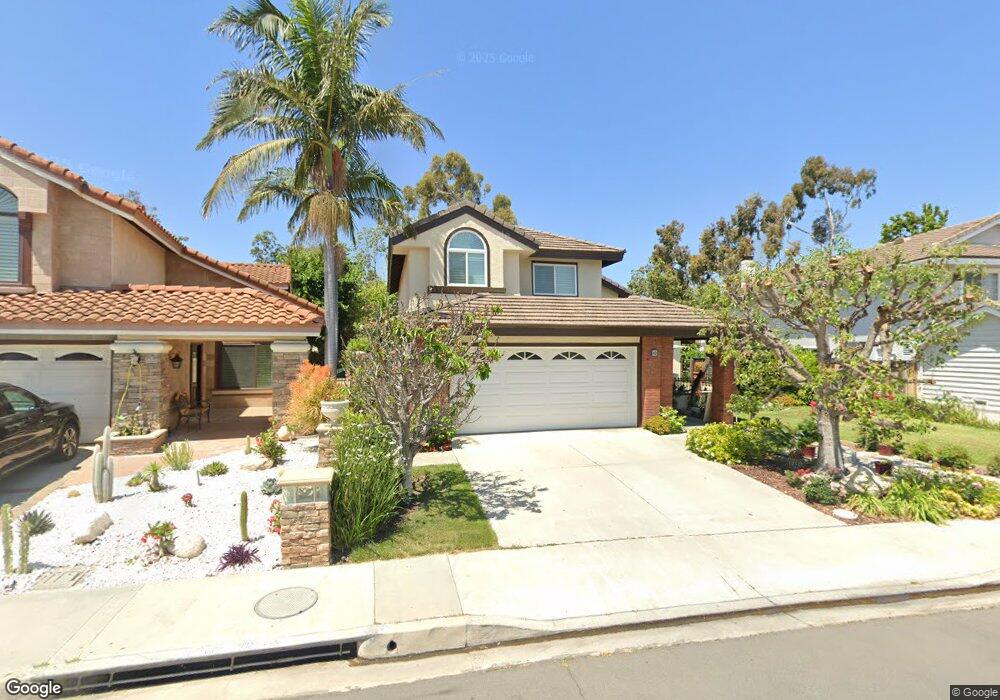
About This Home
This home is located at 40 Wheeler, Irvine, CA 92620 and is currently estimated at $1,864,910, approximately $843 per square foot. 40 Wheeler is a home located in Orange County with nearby schools including Brywood Elementary School, Sierra Vista Middle School, and Northwood High School.
Ownership History
Date
Name
Owned For
Owner Type
Purchase Details
Closed on
Aug 18, 2021
Sold by
Patten Stephen S and Patten Denise F
Bought by
Patten Stephen Sippy and Patten Denise Fern
Current Estimated Value
Purchase Details
Closed on
Apr 5, 2013
Sold by
Patten Stephen S and Patten Denise
Bought by
Patten Stephen S and Patten Denise F
Home Financials for this Owner
Home Financials are based on the most recent Mortgage that was taken out on this home.
Original Mortgage
$417,000
Outstanding Balance
$294,345
Interest Rate
3.47%
Mortgage Type
New Conventional
Estimated Equity
$1,570,565
Purchase Details
Closed on
Nov 15, 2001
Sold by
Schultz Larry and Schultz Terry
Bought by
Patten Stephen S and Patten Denise
Home Financials for this Owner
Home Financials are based on the most recent Mortgage that was taken out on this home.
Original Mortgage
$382,500
Interest Rate
7.37%
Create a Home Valuation Report for This Property
The Home Valuation Report is an in-depth analysis detailing your home's value as well as a comparison with similar homes in the area
Home Values in the Area
Average Home Value in this Area
Purchase History
| Date | Buyer | Sale Price | Title Company |
|---|---|---|---|
| Patten Stephen Sippy | -- | None Available | |
| Patten Stephen S | -- | Equity Title Orange County-I | |
| Patten Stephen S | $425,000 | Chicago Title Co |
Source: Public Records
Mortgage History
| Date | Status | Borrower | Loan Amount |
|---|---|---|---|
| Open | Patten Stephen S | $417,000 | |
| Previous Owner | Patten Stephen S | $382,500 |
Source: Public Records
Tax History
| Year | Tax Paid | Tax Assessment Tax Assessment Total Assessment is a certain percentage of the fair market value that is determined by local assessors to be the total taxable value of land and additions on the property. | Land | Improvement |
|---|---|---|---|---|
| 2025 | $6,620 | $627,843 | $374,660 | $253,183 |
| 2024 | $6,620 | $615,533 | $367,314 | $248,219 |
| 2023 | $6,449 | $603,464 | $360,112 | $243,352 |
| 2022 | $6,323 | $591,632 | $353,051 | $238,581 |
| 2021 | $6,177 | $580,032 | $346,129 | $233,903 |
| 2020 | $6,142 | $574,085 | $342,580 | $231,505 |
| 2019 | $6,005 | $562,829 | $335,863 | $226,966 |
| 2018 | $5,897 | $551,794 | $329,278 | $222,516 |
| 2017 | $5,774 | $540,975 | $322,822 | $218,153 |
| 2016 | $5,521 | $530,368 | $316,492 | $213,876 |
| 2015 | $5,438 | $522,402 | $311,738 | $210,664 |
| 2014 | $5,332 | $512,169 | $305,631 | $206,538 |
Source: Public Records
Map
Nearby Homes
Your Personal Tour Guide
Ask me questions while you tour the home.