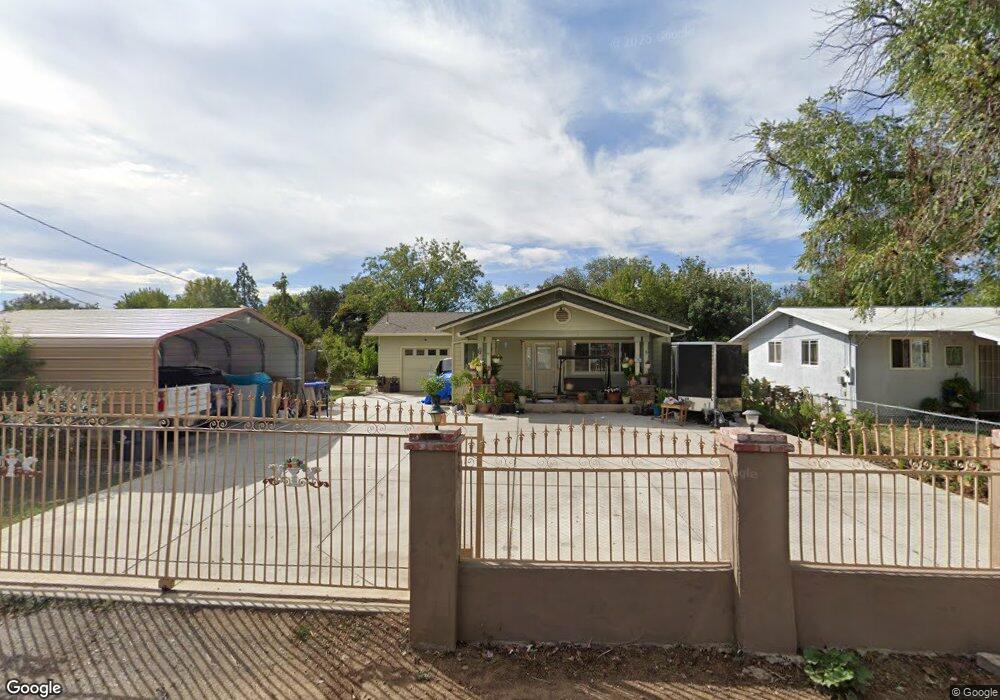
40 Wiltsey Ave Red Bluff, CA 96080
Estimated Value: $266,000 - $299,320
2
Beds
2
Baths
1,344
Sq Ft
$211/Sq Ft
Est. Value
About This Home
This home is located at 40 Wiltsey Ave, Red Bluff, CA 96080 and is currently estimated at $283,830, approximately $211 per square foot. 40 Wiltsey Ave is a home located in Tehama County with nearby schools including Antelope Elementary School, Berrendos Middle School, and Red Bluff High School.
Ownership History
Date
Name
Owned For
Owner Type
Purchase Details
Closed on
Oct 12, 2016
Sold by
Rutter Dorothy Lee
Bought by
Gonzalez Castro Maria D and Ayala Jorge Escamilla
Current Estimated Value
Home Financials for this Owner
Home Financials are based on the most recent Mortgage that was taken out on this home.
Original Mortgage
$130,400
Outstanding Balance
$104,474
Interest Rate
3.44%
Mortgage Type
New Conventional
Estimated Equity
$179,356
Purchase Details
Closed on
Jun 3, 2002
Sold by
Orr Clyde and Orr Arden
Bought by
Orr Clyde and Orr Arden
Purchase Details
Closed on
May 14, 2002
Sold by
Associates Financial Svcs Co Of Ca Inc
Bought by
Orr Clyde L and Orr Arden B
Purchase Details
Closed on
Dec 17, 2001
Sold by
Sullivan Robert and Sullivan Adelia I
Bought by
Associates Financial Services Co Of Ca
Create a Home Valuation Report for This Property
The Home Valuation Report is an in-depth analysis detailing your home's value as well as a comparison with similar homes in the area
Purchase History
| Date | Buyer | Sale Price | Title Company |
|---|---|---|---|
| Gonzalez Castro Maria D | $163,000 | Northern California Title Co | |
| Orr Clyde | -- | -- | |
| Orr Clyde L | $5,000 | Fidelity National Title | |
| Associates Financial Services Co Of Ca | $100,000 | First American Title Co |
Source: Public Records
Mortgage History
| Date | Status | Borrower | Loan Amount |
|---|---|---|---|
| Open | Gonzalez Castro Maria D | $130,400 |
Source: Public Records
Tax History
| Year | Tax Paid | Tax Assessment Tax Assessment Total Assessment is a certain percentage of the fair market value that is determined by local assessors to be the total taxable value of land and additions on the property. | Land | Improvement |
|---|---|---|---|---|
| 2025 | $1,978 | $195,414 | $34,815 | $160,599 |
| 2023 | $1,951 | $187,827 | $33,464 | $154,363 |
| 2022 | $1,836 | $178,262 | $32,808 | $145,454 |
| 2021 | $1,803 | $174,767 | $32,165 | $142,602 |
| 2020 | $1,803 | $172,976 | $31,836 | $141,140 |
| 2019 | $1,796 | $169,585 | $31,212 | $138,373 |
| 2018 | $1,713 | $166,260 | $30,600 | $135,660 |
| 2017 | $1,729 | $163,000 | $30,000 | $133,000 |
| 2016 | $1,248 | $123,406 | $19,550 | $103,856 |
| 2015 | -- | $123,406 | $19,550 | $103,856 |
| 2014 | $1,092 | $107,310 | $17,000 | $90,310 |
Source: Public Records
Map
Nearby Homes
- 220 Gurnsey Dr
- 79 Damon Ave
- 83 Damon Ave
- 105 Kaer Ave
- 321 Antelope Blvd
- 75 Sherman Dr
- 5 Gurnsey Ave
- 105 Kimick Way
- 125 Kimick Way
- 566 Roundup Ave
- 265 Kaer Ave
- 150 Nina Ave
- 55 Mina Ave
- 725 East Ave
- 710 Center Ave
- 350 Gilmore Rd Unit 16
- 195 Howell Ave
- 275 Howell Ave
- 23 Casa Grande Dr
- 1 Casa Grande Dr Unit 1
Your Personal Tour Guide
Ask me questions while you tour the home.