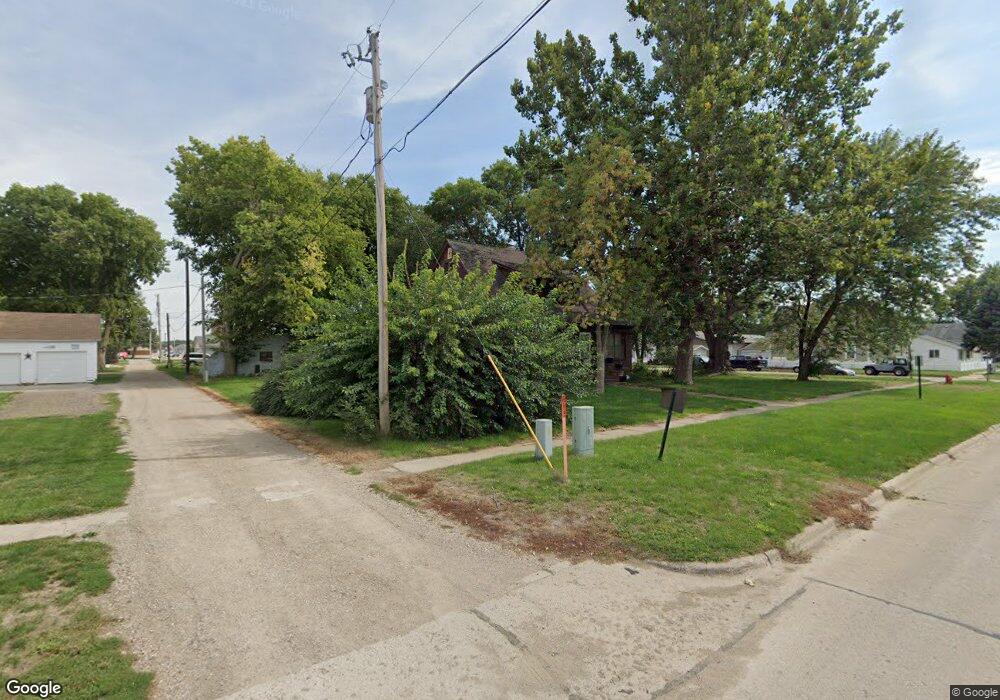
400 C St Sergeant Bluff, IA 51054
Estimated Value: $253,000 - $341,000
3
Beds
2
Baths
2,337
Sq Ft
$124/Sq Ft
Est. Value
About This Home
This home is located at 400 C St, Sergeant Bluff, IA 51054 and is currently estimated at $289,219, approximately $123 per square foot. 400 C St is a home with nearby schools including Sergeant Bluff-Luton Primary School, Sergeant Bluff-Luton Elementary School, and Sergeant Bluff-Luton Middle School.
Ownership History
Date
Name
Owned For
Owner Type
Purchase Details
Closed on
Oct 22, 2005
Sold by
Mclarty Edwin L and Mclarty Deborah M
Bought by
Slocum Mary D
Current Estimated Value
Home Financials for this Owner
Home Financials are based on the most recent Mortgage that was taken out on this home.
Original Mortgage
$116,100
Outstanding Balance
$63,001
Interest Rate
5.98%
Mortgage Type
New Conventional
Estimated Equity
$226,218
Create a Home Valuation Report for This Property
The Home Valuation Report is an in-depth analysis detailing your home's value as well as a comparison with similar homes in the area
Home Values in the Area
Average Home Value in this Area
Purchase History
| Date | Buyer | Sale Price | Title Company |
|---|---|---|---|
| Slocum Mary D | $12,900 | None Available |
Source: Public Records
Mortgage History
| Date | Status | Borrower | Loan Amount |
|---|---|---|---|
| Open | Slocum Mary D | $116,100 |
Source: Public Records
Tax History
| Year | Tax Paid | Tax Assessment Tax Assessment Total Assessment is a certain percentage of the fair market value that is determined by local assessors to be the total taxable value of land and additions on the property. | Land | Improvement |
|---|---|---|---|---|
| 2025 | $3,150 | $234,520 | $25,340 | $209,180 |
| 2024 | $32 | $228,200 | $22,620 | $205,580 |
| 2023 | $3,296 | $228,200 | $22,620 | $205,580 |
| 2022 | $3,268 | $187,620 | $22,620 | $165,000 |
| 2021 | $3,268 | $187,620 | $22,620 | $165,000 |
| 2020 | $3,022 | $170,130 | $24,200 | $145,930 |
| 2019 | $2,920 | $170,130 | $24,200 | $145,930 |
| 2018 | $2,812 | $159,950 | $24,200 | $135,750 |
| 2017 | $3,048 | $159,950 | $24,200 | $135,750 |
| 2016 | $3,312 | $170,480 | $0 | $0 |
| 2015 | $2,933 | $159,330 | $22,620 | $136,710 |
| 2014 | $2,932 | $146,800 | $22,620 | $124,180 |
Source: Public Records
Map
Nearby Homes
Your Personal Tour Guide
Ask me questions while you tour the home.