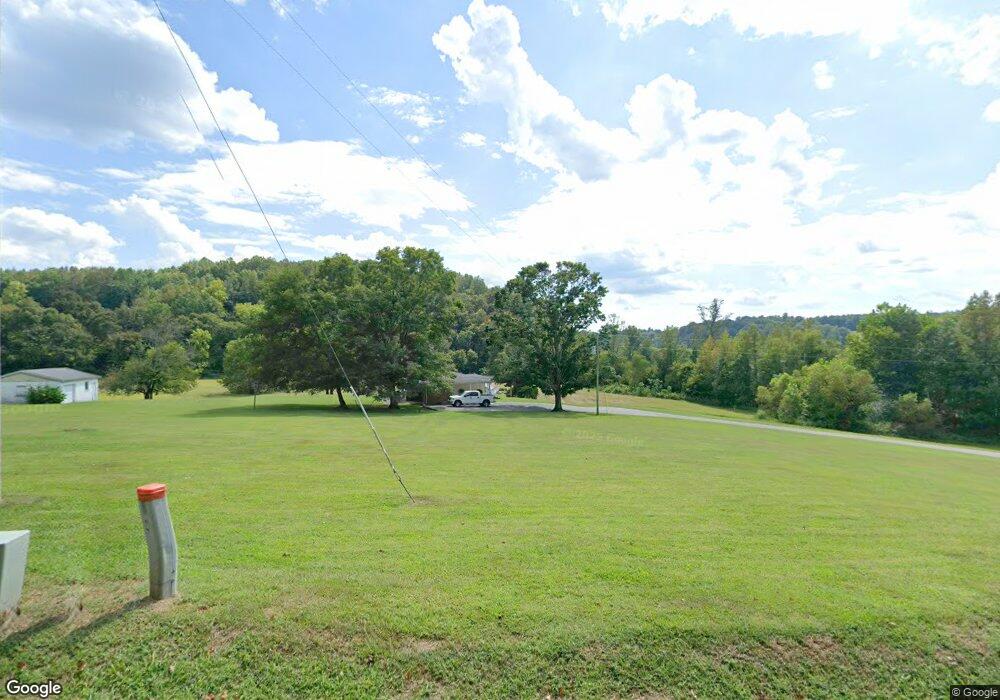
400 Charley Davis Rd Goodspring, TN 38460
Estimated Value: $228,836
4
Beds
3
Baths
2,382
Sq Ft
$96/Sq Ft
Est. Value
About This Home
This home is located at 400 Charley Davis Rd, Goodspring, TN 38460 and is currently priced at $228,836, approximately $96 per square foot. 400 Charley Davis Rd is a home located in Giles County with nearby schools including Minor Hill School and Giles County High School.
Ownership History
Date
Name
Owned For
Owner Type
Purchase Details
Closed on
Nov 7, 2022
Sold by
Thompson Barry
Bought by
Amesbury David G and Smith Amesbury Tammie
Current Estimated Value
Purchase Details
Closed on
Jul 24, 2017
Sold by
Thompson Barry N and Thompson Rhonda
Bought by
Randolph Dwayne and Randolph Sonia
Purchase Details
Closed on
Feb 21, 2014
Sold by
Thompson Charles F
Bought by
Thompson Barry and Thompson Rhonda
Home Financials for this Owner
Home Financials are based on the most recent Mortgage that was taken out on this home.
Original Mortgage
$50,000
Interest Rate
4.43%
Mortgage Type
New Conventional
Purchase Details
Closed on
Feb 15, 2000
Sold by
Thompson Barry N
Bought by
Mcintyre David M and Mcintyre Malinda
Purchase Details
Closed on
Dec 2, 1997
Sold by
Thompson Barry N
Bought by
Harper James M and Harper Carol
Purchase Details
Closed on
Dec 30, 1995
Bought by
Thompson Barry N
Purchase Details
Closed on
Dec 13, 1995
Bought by
Thompson Barry and Thompson Rhonda
Create a Home Valuation Report for This Property
The Home Valuation Report is an in-depth analysis detailing your home's value as well as a comparison with similar homes in the area
Purchase History
| Date | Buyer | Sale Price | Title Company |
|---|---|---|---|
| Amesbury David G | $124,500 | -- | |
| Randolph Dwayne | $170,000 | Title And Escrow Llc | |
| Thompson Barry | $60,000 | -- | |
| Mcintyre David M | $70,400 | -- | |
| Harper James M | $8,000 | -- | |
| Thompson Barry N | $70,000 | -- | |
| Thompson Barry | $70,000 | -- |
Source: Public Records
Mortgage History
| Date | Status | Borrower | Loan Amount |
|---|---|---|---|
| Previous Owner | Thompson Barry | $50,000 |
Source: Public Records
Tax History
| Year | Tax Paid | Tax Assessment Tax Assessment Total Assessment is a certain percentage of the fair market value that is determined by local assessors to be the total taxable value of land and additions on the property. | Land | Improvement |
|---|---|---|---|---|
| 2022 | $207 | $10,425 | $10,425 | $0 |
| 2021 | $230 | $8,125 | $8,125 | $0 |
| 2020 | $230 | $8,125 | $8,125 | $0 |
| 2019 | $1,618 | $57,275 | $11,425 | $45,850 |
| 2018 | $1,618 | $57,275 | $11,425 | $45,850 |
| 2017 | $2,013 | $57,275 | $11,425 | $45,850 |
| 2016 | $1,892 | $63,675 | $17,975 | $45,700 |
| 2015 | $1,647 | $59,425 | $17,975 | $41,450 |
| 2014 | $1,647 | $59,444 | $0 | $0 |
Source: Public Records
Map
Nearby Homes
- 1087 Charley Davis Rd
- 590 Jackson Hollow Rd
- 950 Puncheon Branch Rd
- 700 Kincaid Rd
- 1825 Powell School Rd
- 495 Salem Rd
- 0 W Hollow Rd
- 4025 Cowhorne Hollow Rd
- 0 Shoal Creek Rd
- 449 Miller Ln
- 0 Tbd Davis Hollow Rd
- 0 Cowhorne Hollow Rd Unit RTC2797145
- 105 Pollock Hollow Rd
- 1200 Wray Branch Rd
- 3310 Dog Branch Rd
- 1149 Oak Grove Rd
- 890 Oak Grove Rd
- 1020 Fall River Rd
- 972 Fall River Rd
- 2725 Agnew Rd
- 305 Charley Davis Rd
- 222 Charley Davis Rd
- 309 Charley Davis Rd
- 11153 Minor Hill Hwy
- 11077 Minor Hill Hwy
- 10999 Minor Hill Hwy
- 936 Charlie Davis Rd
- 10999 Hwy 11
- 11220 Minor Hill Hwy Unit 11
- 10891 Minor Hill Hwy
- 10811 Minor Hill Hwy
- 225 Dillon Ln
- 101 Hayes Rd
- 101 Hayes Rd
- 101 Hays Rd
- 101 Hays Rd
- 11555 Minor Hill Hwy Unit 11
- 11607 Minor Hill Hwy
- 1030 Charley Davis Rd
- 11556 Minor Hill Hwy
Your Personal Tour Guide
Ask me questions while you tour the home.