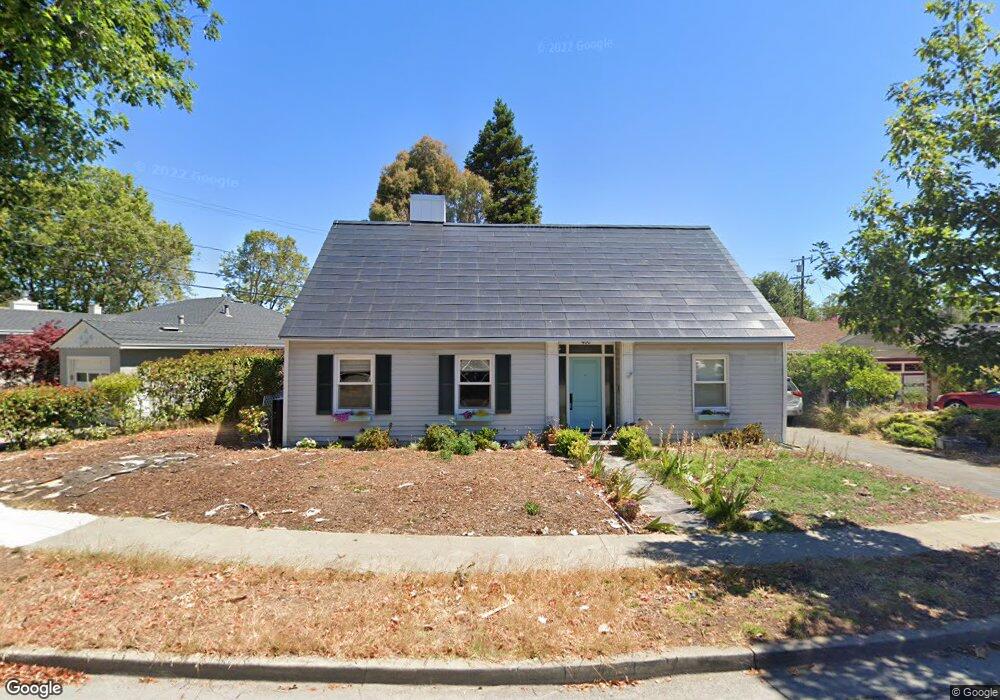
400 Dwight Rd Burlingame, CA 94010
Oak Grove Manor NeighborhoodEstimated Value: $2,285,000 - $3,434,000
4
Beds
2
Baths
2,090
Sq Ft
$1,429/Sq Ft
Est. Value
About This Home
This home is located at 400 Dwight Rd, Burlingame, CA 94010 and is currently estimated at $2,987,096, approximately $1,429 per square foot. 400 Dwight Rd is a home located in San Mateo County with nearby schools including Washington Elementary School, Burlingame Intermediate School, and Burlingame High School.
Ownership History
Date
Name
Owned For
Owner Type
Purchase Details
Closed on
Jul 13, 2022
Sold by
Max Flanzer Douglas
Current Estimated Value
Purchase Details
Closed on
Aug 5, 2011
Sold by
Crooks Steven M and Miranda Helen G
Bought by
Flanzer Douglas Max and Flanzer Amy Michele
Home Financials for this Owner
Home Financials are based on the most recent Mortgage that was taken out on this home.
Original Mortgage
$500,000
Interest Rate
4.46%
Mortgage Type
New Conventional
Purchase Details
Closed on
Sep 1, 2006
Sold by
Steinberger David and Steinberger Elyse
Bought by
Crooks Steven M and Miranda Helen G
Home Financials for this Owner
Home Financials are based on the most recent Mortgage that was taken out on this home.
Original Mortgage
$1,000,000
Interest Rate
6.5%
Mortgage Type
Purchase Money Mortgage
Purchase Details
Closed on
Dec 3, 1998
Sold by
Seal Kathleen F and Seal Kathleen F
Bought by
Steinberger David and Steinberger Elyse
Home Financials for this Owner
Home Financials are based on the most recent Mortgage that was taken out on this home.
Original Mortgage
$440,000
Interest Rate
6.75%
Create a Home Valuation Report for This Property
The Home Valuation Report is an in-depth analysis detailing your home's value as well as a comparison with similar homes in the area
Home Values in the Area
Average Home Value in this Area
Purchase History
| Date | Buyer | Sale Price | Title Company |
|---|---|---|---|
| -- | -- | None Listed On Document | |
| Flanzer Douglas Max | $1,190,000 | North American Title Co Inc | |
| Crooks Steven M | $1,250,000 | North American Title Company | |
| Steinberger David | $550,000 | North American Title Insuran |
Source: Public Records
Mortgage History
| Date | Status | Borrower | Loan Amount |
|---|---|---|---|
| Previous Owner | Flanzer Douglas Max | $500,000 | |
| Previous Owner | Crooks Steven M | $1,000,000 | |
| Previous Owner | Steinberger David | $440,000 | |
| Closed | Steinberger David | $55,000 |
Source: Public Records
Tax History
| Year | Tax Paid | Tax Assessment Tax Assessment Total Assessment is a certain percentage of the fair market value that is determined by local assessors to be the total taxable value of land and additions on the property. | Land | Improvement |
|---|---|---|---|---|
| 2025 | $16,896 | $1,509,123 | $747,346 | $761,777 |
| 2023 | $16,896 | $1,450,526 | $718,327 | $732,199 |
| 2022 | $16,373 | $1,422,086 | $704,243 | $717,843 |
| 2021 | $16,243 | $1,380,870 | $690,435 | $690,435 |
| 2020 | $15,907 | $1,366,712 | $683,356 | $683,356 |
| 2019 | $15,556 | $1,339,914 | $669,957 | $669,957 |
| 2018 | $15,261 | $1,313,642 | $656,821 | $656,821 |
| 2017 | $15,150 | $1,287,886 | $643,943 | $643,943 |
| 2016 | $14,594 | $1,262,634 | $631,317 | $631,317 |
| 2015 | $14,530 | $1,243,670 | $621,835 | $621,835 |
| 2014 | $14,320 | $1,219,310 | $609,655 | $609,655 |
Source: Public Records
Map
Nearby Homes
- 200 Anita Rd
- 39 Victoria Rd
- 10 Channing Rd
- 422 Peninsula Ave
- 869 Woodside Way
- 320 Peninsula Ave Unit 409
- 320 Peninsula Ave Unit 316
- 728 Laurel Ave
- 808 Winchester Dr
- 748 Laurel Ave
- 815 N Humboldt St Unit 508
- 932 Peninsula Ave Unit 406
- 821 N Humboldt St Unit 309
- 833 N Humboldt St Unit 201
- 934 Peninsula Ave Unit 301
- 835 N Humboldt St Unit 203
- 800 N Delaware St Unit 303
- 816 N Delaware St Unit 409
- 820 N Delaware St Unit 215
- 948 Peninsula Ave
- 404 Dwight Rd
- 340 Dwight Rd
- 385 Lexington Way
- 391 Lexington Way
- 336 Dwight Rd
- 379 Lexington Way
- 373 Lexington Way
- 409 Dwight Rd
- 332 Dwight Rd
- 600 Vernon Way
- 341 Dwight Rd
- 545 Vernon Way
- 367 Lexington Way
- 394 Lexington Way
- 603 Lexington Way
- 328 Dwight Rd
- 336 Clarendon Rd
- 355 Lexington Way
- 333 Dwight Rd
- 608 Vernon Way
Your Personal Tour Guide
Ask me questions while you tour the home.