Estimated Value: $563,000 - $638,000
3
Beds
2
Baths
1,720
Sq Ft
$351/Sq Ft
Est. Value
About This Home
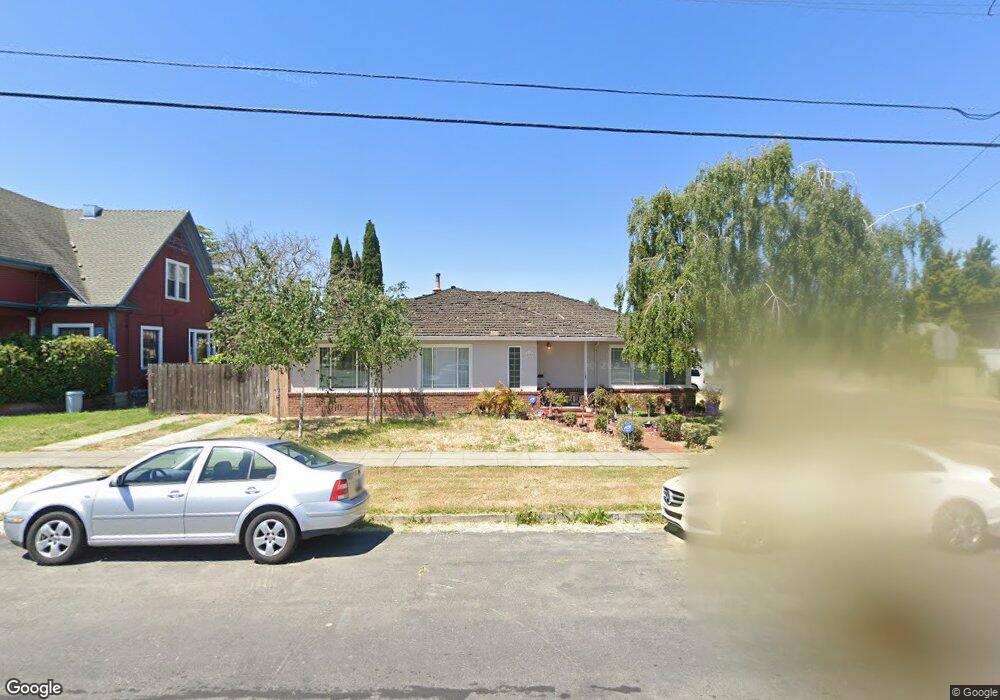
This home is located at 400 Garretson Ave, Rodeo, CA 94572 and is currently estimated at $603,888, approximately $351 per square foot. 400 Garretson Ave is a home located in Contra Costa County with nearby schools including Rodeo Hills Elementary School, Carquinez Middle School, and John Swett High School.
Ownership History
Date
Name
Owned For
Owner Type
Purchase Details
Closed on
Aug 4, 2017
Sold by
Huang Rendong and Huang Kang
Bought by
Ho Hoa Thi and Pham Lac
Current Estimated Value
Home Financials for this Owner
Home Financials are based on the most recent Mortgage that was taken out on this home.
Original Mortgage
$453,296
Outstanding Balance
$378,240
Interest Rate
3.96%
Mortgage Type
New Conventional
Estimated Equity
$225,648
Purchase Details
Closed on
Nov 20, 2012
Sold by
Lin Xiao Yan
Bought by
Huang Rendong and Huang Kang
Purchase Details
Closed on
Nov 14, 2012
Sold by
Miller Scott
Bought by
Lin Xiaoyan
Purchase Details
Closed on
Nov 4, 2005
Sold by
Callahan Scott A and Callahan Lorrie L
Bought by
Miller Scott
Home Financials for this Owner
Home Financials are based on the most recent Mortgage that was taken out on this home.
Original Mortgage
$424,000
Interest Rate
1%
Mortgage Type
Fannie Mae Freddie Mac
Create a Home Valuation Report for This Property
The Home Valuation Report is an in-depth analysis detailing your home's value as well as a comparison with similar homes in the area
Home Values in the Area
Average Home Value in this Area
Purchase History
| Date | Buyer | Sale Price | Title Company |
|---|---|---|---|
| Ho Hoa Thi | $469,000 | Old Republic Title Company | |
| Huang Rendong | -- | None Available | |
| Lin Xiaoyan | $180,000 | First American Title Company | |
| Miller Scott | $530,000 | First American Title |
Source: Public Records
Mortgage History
| Date | Status | Borrower | Loan Amount |
|---|---|---|---|
| Open | Ho Hoa Thi | $453,296 | |
| Previous Owner | Miller Scott | $424,000 |
Source: Public Records
Tax History
| Year | Tax Paid | Tax Assessment Tax Assessment Total Assessment is a certain percentage of the fair market value that is determined by local assessors to be the total taxable value of land and additions on the property. | Land | Improvement |
|---|---|---|---|---|
| 2025 | $7,750 | $533,637 | $257,147 | $276,490 |
| 2024 | $7,522 | $523,174 | $252,105 | $271,069 |
| 2023 | $7,522 | $512,916 | $247,162 | $265,754 |
| 2022 | $7,390 | $502,860 | $242,316 | $260,544 |
| 2021 | $7,248 | $493,001 | $237,565 | $255,436 |
| 2019 | $7,071 | $478,380 | $230,520 | $247,860 |
| 2018 | $6,874 | $469,000 | $226,000 | $243,000 |
| 2017 | $3,685 | $190,983 | $101,858 | $89,125 |
| 2016 | $3,381 | $187,239 | $99,861 | $87,378 |
| 2015 | $3,355 | $184,427 | $98,361 | $86,066 |
| 2014 | $3,300 | $180,816 | $96,435 | $84,381 |
Source: Public Records
Map
Nearby Homes
- 215 4th St
- 343 Rodeo Ave
- 1012 Rock Harbor Point
- 229 Lake Ave
- 106 White Cap Cove
- 220 Vaqueros Ave
- 601 Napa Ave
- 715 Mariposa Ave
- 1027 3rd St
- 1334 7th St
- 836 Hawthorne Dr
- 909 Seascape Cir
- 834 Coral Ridge Cir
- 943 Coral Ridge Cir
- 801 Dover
- 704 Windsor Unit 704
- 120 Bonita Ct
- 405 Weymouth
- 2036 Serra Ln
- 2054 Clark St
- 225 4th St
- 416 Garretson Ave
- 422 Garretson Ave
- 382 Garretson Ave
- 305 4th St
- 411 Garretson Ave
- 207 4th St
- 436 Garretson Ave
- 417 Garretson Ave
- 378 Garretson Ave
- 218 4th St
- 220 4th St
- 423 Harris Ave
- 201 4th St
- 438 Garretson Ave
- 216 4th St
- 376 Garretson Ave
- 423 Garretson Ave
- 381 Garretson Ave
- 435 Harris Ave
Your Personal Tour Guide
Ask me questions while you tour the home.