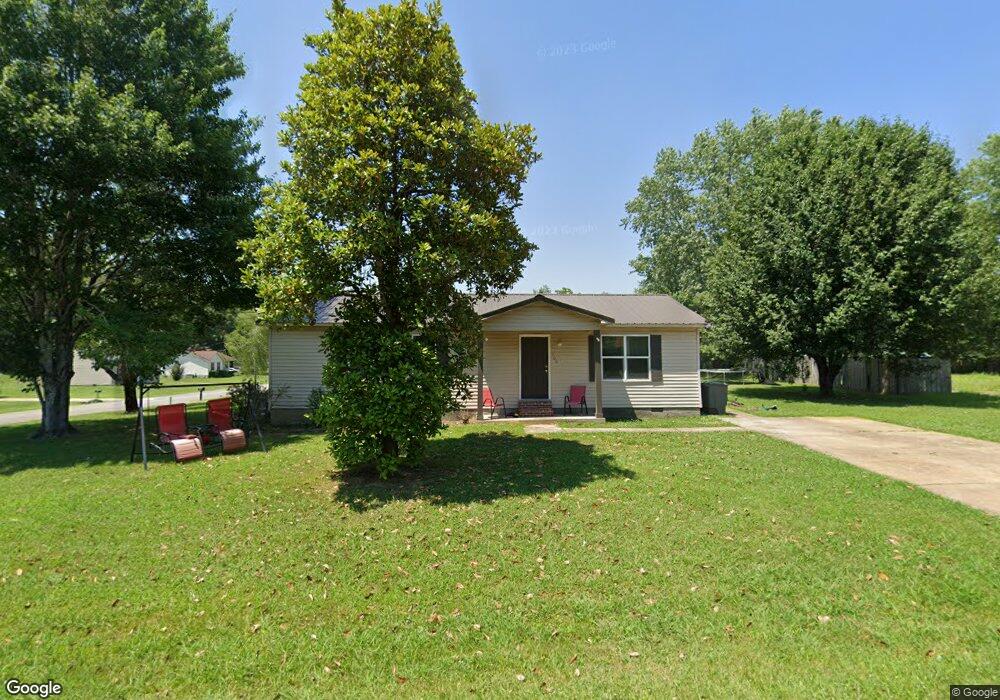
400 McGee Loop Jackson, TN 38305
Estimated Value: $120,000 - $170,000
Studio
1
Bath
1,150
Sq Ft
$134/Sq Ft
Est. Value
About This Home
This home is located at 400 McGee Loop, Jackson, TN 38305 and is currently estimated at $153,714, approximately $133 per square foot. 400 McGee Loop is a home located in Madison County with nearby schools including East Elementary School, Northeast Middle School, and North Side High School.
Ownership History
Date
Name
Owned For
Owner Type
Purchase Details
Closed on
May 23, 2019
Sold by
Martin Heather Michelle and Martin Michael E
Bought by
Dorris Clint
Current Estimated Value
Purchase Details
Closed on
Apr 26, 2004
Sold by
Tennessee Housing Dev Agen
Bought by
Michelle Stewart Heather
Purchase Details
Closed on
Dec 10, 2003
Sold by
Wallis Edwin E Jr Sub Tr
Bought by
Thda
Purchase Details
Closed on
Jun 12, 2003
Sold by
Wallis Edwin E
Bought by
Thda
Purchase Details
Closed on
Jun 23, 1999
Bought by
Moore Steve M and Moore Tasha
Purchase Details
Closed on
Dec 6, 1996
Sold by
Bank Of Dyer
Bought by
George Ballard
Purchase Details
Closed on
Jun 14, 1996
Sold by
Gatlin Richard H
Bought by
Bank Of Dyer
Purchase Details
Closed on
Feb 15, 1990
Bought by
Gatlin Richard H
Purchase Details
Closed on
Nov 10, 1989
Bought by
Smallwood Dev Co
Purchase Details
Closed on
Apr 8, 1955
Bought by
Mcgee James C
Create a Home Valuation Report for This Property
The Home Valuation Report is an in-depth analysis detailing your home's value as well as a comparison with similar homes in the area
Purchase History
| Date | Buyer | Sale Price | Title Company |
|---|---|---|---|
| Dorris Clint | $33,500 | None Available | |
| Michelle Stewart Heather | $56,000 | -- | |
| Thda | $79,780 | -- | |
| Thda | -- | -- | |
| Moore Steve M | $72,900 | -- | |
| George Ballard | $52,000 | -- | |
| Bank Of Dyer | $53,167 | -- | |
| Gatlin Richard H | -- | -- | |
| Smallwood Dev Co | -- | -- | |
| Mcgee James C | -- | -- |
Source: Public Records
Tax History
| Year | Tax Paid | Tax Assessment Tax Assessment Total Assessment is a certain percentage of the fair market value that is determined by local assessors to be the total taxable value of land and additions on the property. | Land | Improvement |
|---|---|---|---|---|
| 2025 | $512 | $27,350 | $5,000 | $22,350 |
| 2024 | $512 | $27,350 | $5,000 | $22,350 |
| 2022 | $512 | $27,350 | $5,000 | $22,350 |
| 2021 | $373 | $15,875 | $3,150 | $12,725 |
| 2020 | $373 | $15,875 | $3,150 | $12,725 |
| 2019 | $373 | $15,875 | $3,150 | $12,725 |
| 2018 | $373 | $15,875 | $3,150 | $12,725 |
| 2017 | $388 | $15,850 | $3,150 | $12,700 |
| 2016 | $341 | $15,850 | $3,150 | $12,700 |
| 2015 | $341 | $15,850 | $3,150 | $12,700 |
| 2014 | $335 | $15,575 | $3,150 | $12,425 |
Source: Public Records
Map
Nearby Homes
- 99 Hidden Valley Dr
- 91 McGee Loop
- 24 Palmetto Cove
- 0 Interstate 40 Unit 2505648
- 0 Interstate 40
- 111 Henderson Rd
- 0 U S Highway 412
- 0 Red Gum Ln & Old Medina Crossing Ln Unit 10195533
- 85 Old Medina Crossing
- 20 Bink Dr
- 21 Bluebird Cove
- 2888 Old Medina Rd
- 189 Valley Oak Loop
- 00 Chloe Place
- 41 International Cove
- 31 Mack St
- 339 Parkstone Place
- 283 Parkstone Place
- 130 Campbell Oaks Dr
- 62 Beth Place
- 10 Lost Creek Dr
- 408 McGee Loop
- 399 McGee Loop
- 407 McGee Loop
- 390 McGee Loop
- 18 Lost Creek Dr
- 391 McGee Loop
- 175 Henderson Rd
- 11 Lost Creek Dr
- 185 Henderson Rd
- 415 McGee Loop
- 19 Lost Creek Dr
- 389 McGee Loop
- 24 Lost Creek Dr
- 27 Lost Creek Dr
- 381 McGee Loop
- 384 McGee Loop
- 378 McGee Loop
- 40 Weston Dr
- 197 Henderson Rd
Your Personal Tour Guide
Ask me questions while you tour the home.