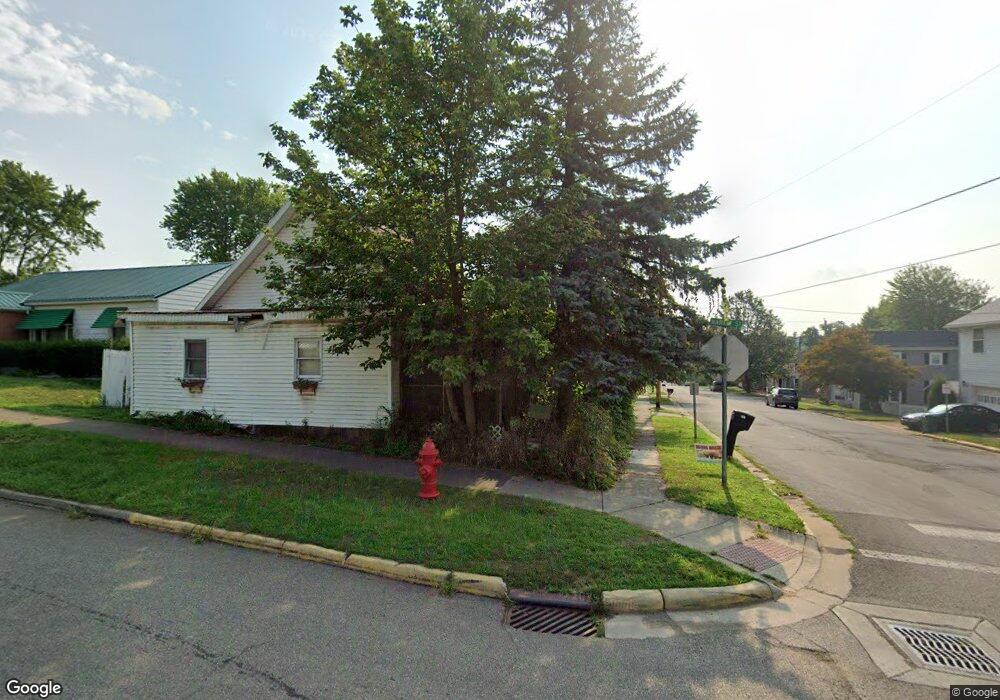
400 N Market St Shreve, OH 44676
Estimated Value: $120,114 - $237,000
4
Beds
2
Baths
1,684
Sq Ft
$113/Sq Ft
Est. Value
About This Home
This home is located at 400 N Market St, Shreve, OH 44676 and is currently estimated at $190,279, approximately $112 per square foot. 400 N Market St is a home located in Wayne County with nearby schools including Triway High School, Sunny Slope C/O Ervin Mast, and ORCHARD LANE SCHOOL.
Ownership History
Date
Name
Owned For
Owner Type
Purchase Details
Closed on
Feb 1, 1996
Sold by
Force James J
Bought by
Nicholas Lloyd
Current Estimated Value
Purchase Details
Closed on
Nov 23, 1993
Sold by
Force James J and Force John C
Bought by
Force James J and Force John C
Create a Home Valuation Report for This Property
The Home Valuation Report is an in-depth analysis detailing your home's value as well as a comparison with similar homes in the area
Home Values in the Area
Average Home Value in this Area
Purchase History
| Date | Buyer | Sale Price | Title Company |
|---|---|---|---|
| Nicholas Lloyd | $16,000 | -- | |
| Force James J | -- | -- |
Source: Public Records
Tax History Compared to Growth
Tax History
| Year | Tax Paid | Tax Assessment Tax Assessment Total Assessment is a certain percentage of the fair market value that is determined by local assessors to be the total taxable value of land and additions on the property. | Land | Improvement |
|---|---|---|---|---|
| 2024 | $909 | $23,350 | $5,500 | $17,850 |
| 2023 | $909 | $23,350 | $5,500 | $17,850 |
| 2022 | $873 | $20,190 | $4,780 | $15,410 |
| 2021 | $874 | $20,190 | $4,780 | $15,410 |
| 2020 | $794 | $20,190 | $4,780 | $15,410 |
| 2019 | $799 | $19,670 | $4,260 | $15,410 |
| 2018 | $803 | $19,670 | $4,260 | $15,410 |
| 2017 | $800 | $19,670 | $4,260 | $15,410 |
| 2016 | $776 | $18,920 | $4,100 | $14,820 |
| 2015 | $759 | $18,920 | $4,100 | $14,820 |
| 2014 | $779 | $18,920 | $4,100 | $14,820 |
| 2013 | $410 | $18,100 | $3,550 | $14,550 |
Source: Public Records
Map
Nearby Homes
- 270 Church St
- 286 E Robinson St
- 292 E Mcconkey St
- 770 N Market St
- 265 S Main St
- 3333 Force Rd
- 9139 County Road 51
- 5001 S Jefferson Rd
- 7241 S Funk Rd
- 110 S Elyria Rd
- 4624 S Elyria Rd
- 3532 Triway Ln
- 4220 S Elyria Rd
- 2560 Rutt Ct
- 7884 Township Road 508
- 3979 Batdorf Rd
- 0 E Moreland Rd
- 3940 Batdorf Rd
- 6991 Township Road 555
- 0 Batdorf Rd
- 432 N Market St
- 204 E Wood St
- 204 E Wood St
- 464 N Market St
- 398 N Market St
- 203 E Wood St
- 496 N Market St
- 443 N Market St
- 216 E Wood St
- 380 N Market St
- 397 N Market St
- 467 N Market St
- 222 E Wood St
- 261 Church St
- 371 N Market St
- 385 N Market St
- 499 N Market St
- 0 E Church St Unit 133 3210150
- 236 E Wood St
- 348 N Market St