400 Redcliff Dr Redding, CA 96002
Estimated Value: $1,802,976
Studio
--
Bath
6,200
Sq Ft
$291/Sq Ft
Est. Value
About This Home
This home is located at 400 Redcliff Dr, Redding, CA 96002 and is currently estimated at $1,802,976, approximately $290 per square foot. 400 Redcliff Dr is a home located in Shasta County with nearby schools including Rother Elementary School, Parsons Junior High School, and Enterprise High School.
Ownership History
Date
Name
Owned For
Owner Type
Purchase Details
Closed on
Oct 21, 2025
Sold by
Joe Wong Family Trust and Wong Joanna L
Bought by
Pomaikai Holdings Llc
Current Estimated Value
Home Financials for this Owner
Home Financials are based on the most recent Mortgage that was taken out on this home.
Original Mortgage
$1,440,000
Outstanding Balance
$1,440,000
Interest Rate
6.35%
Mortgage Type
New Conventional
Estimated Equity
$362,976
Purchase Details
Closed on
Dec 27, 2021
Sold by
Wong Joseph K and Joe Wong Family Trust
Bought by
Wong Joseph K and Joe Wong Family Trust
Home Financials for this Owner
Home Financials are based on the most recent Mortgage that was taken out on this home.
Original Mortgage
$950,000
Interest Rate
3.12%
Mortgage Type
Stand Alone Refi Refinance Of Original Loan
Purchase Details
Closed on
Jun 14, 2016
Sold by
Spacone Hank M
Bought by
Wong Joe
Create a Home Valuation Report for This Property
The Home Valuation Report is an in-depth analysis detailing your home's value as well as a comparison with similar homes in the area
Purchase History
| Date | Buyer | Sale Price | Title Company |
|---|---|---|---|
| Pomaikai Holdings Llc | $1,800,000 | Placer Title | |
| Wong Joseph K | -- | Fidelity Natl Ttl Co Of Ca | |
| Wong Joe | $1,100,000 | Placer Title Company |
Source: Public Records
Mortgage History
| Date | Status | Borrower | Loan Amount |
|---|---|---|---|
| Open | Pomaikai Holdings Llc | $1,440,000 | |
| Previous Owner | Wong Joseph K | $950,000 |
Source: Public Records
Tax History
| Year | Tax Paid | Tax Assessment Tax Assessment Total Assessment is a certain percentage of the fair market value that is determined by local assessors to be the total taxable value of land and additions on the property. | Land | Improvement |
|---|---|---|---|---|
| 2025 | $14,208 | $2,000,000 | $800,000 | $1,200,000 |
| 2024 | $14,012 | $1,276,638 | $406,201 | $870,437 |
| 2023 | $14,012 | $1,251,607 | $398,237 | $853,370 |
| 2022 | $13,618 | $1,227,067 | $390,429 | $836,638 |
| 2021 | $13,157 | $1,203,008 | $382,774 | $820,234 |
| 2020 | $13,101 | $1,190,674 | $378,850 | $811,824 |
| 2019 | $12,996 | $1,167,328 | $371,422 | $795,906 |
| 2018 | $12,849 | $1,144,440 | $364,140 | $780,300 |
| 2017 | $13,076 | $1,122,000 | $357,000 | $765,000 |
| 2016 | $8,773 | $783,446 | $60,003 | $723,443 |
| 2015 | $8,744 | $775,448 | $59,102 | $716,346 |
| 2014 | $8,691 | $761,010 | $57,945 | $703,065 |
Source: Public Records
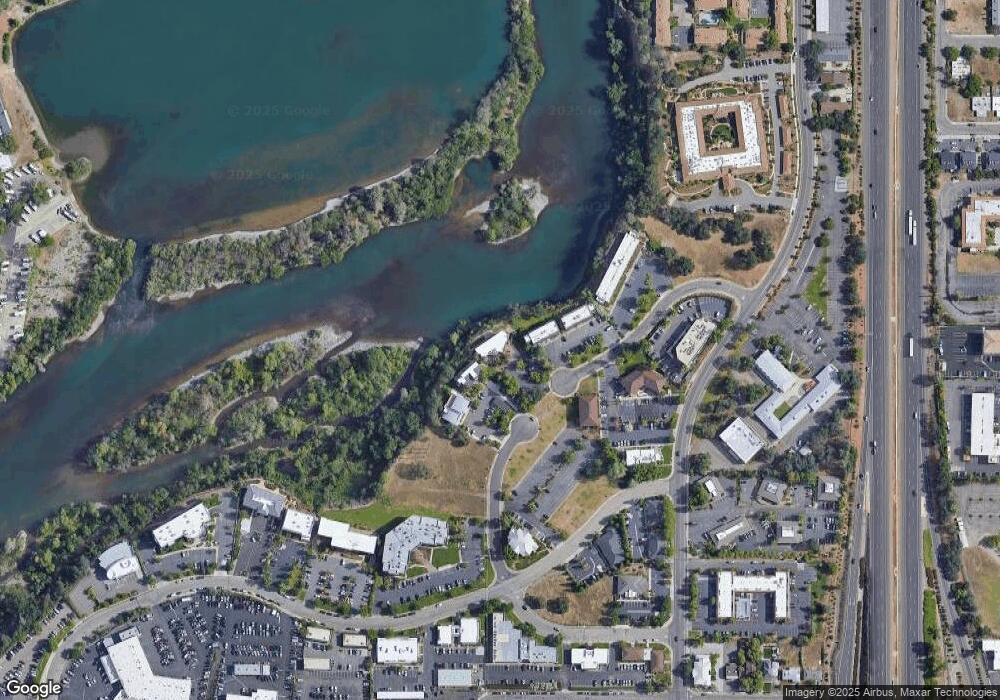
Map
Nearby Homes
- 1968 Bechelli Ln
- 1928 Bechelli Ln
- 350 Park Marina Cir
- 2590 Henderson Rd
- 2165 Paris Ave
- 1005 Grissom Ct
- 1018 Pineland Dr
- 649 Lowe St
- 2861 Shotwick Trail
- 2935 Shotwick Trail
- 890 Parsons Dr
- 1750 Hawthorne Ct
- 3081 Henderson Rd
- 0 Churn Creek Rd Unit 25-496
- 0 Churn Creek Rd Unit 26-609
- 745 Parkview Ave
- 815 Locust St
- 3140 C St
- 2631 Alfreda Way
- 3087 Northwoods Way
- 300 Knollcrest Dr
- 434 Redcliff Dr
- 405 Redcliff Dr Unit 210
- 405 Redcliff Dr
- 333 Knollcrest Dr
- 429 Redcliff Dr
- 348 Knollcrest Dr
- 468 Hemsted Dr
- 0 Hemsted Dr Unit 11-545
- 0 Hemsted Dr Unit 11-544
- 0 Hemsted Dr Unit 13-3710
- 444 Hemsted Dr
- 2280 Bechelli Ln
- 401 Hemsted Dr
- 410 Hemsted Dr
- 2280 Bechelli Ln
- 443 Redcliff Dr
- 0 Knollcrest Dr
- 364 Knollcrest Dr
- 499 Ste. B Hemsted Dr
Your Personal Tour Guide
Ask me questions while you tour the home.