J
Seller's Agent in 2025
Joseph Baglio
Back Bay Residential
(617) 669-4414
3 in this area
4 Total Sales
Estimated Value: $1,085,737 - $1,631,000
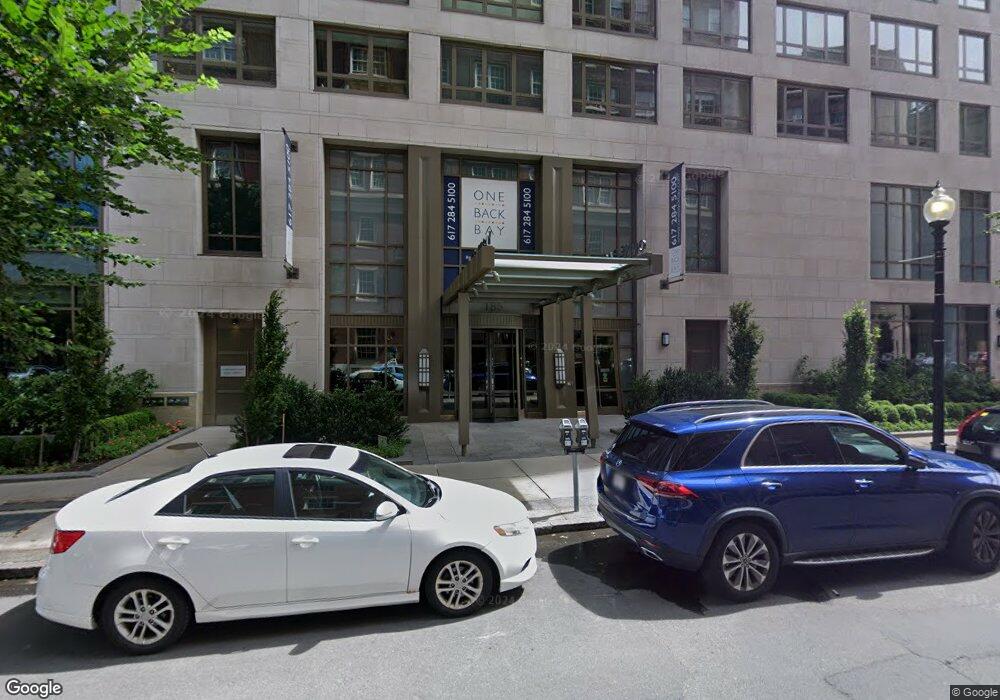
Elegant Fully Furnished One-Bedroom at The Iconic Clarendon Residences Experience refined living in this spacious, fully furnished one-bedroom located in the iconic Clarendon Residences—a full-service luxury building nestled between Back Bay and the South End. Enjoy the convenience of 24-hour concierge service and the vibrancy of one of Boston’s most coveted neighborhoods. This residence features: Gleaming hardwood floors and soaring ceilings. A chef’s kitchen with gas cooking, Sub-Zero refrigerator, Miele dishwasher, and wine cooler generously sized bedroom with a queen bed and ample closet space. Laundry in unit. Perfect for those seeking upscale comfort and unbeatable location. Gym, Tenant Lounge, and Deck. Parking available.
| Date | Buyer | Sale Price | Title Company |
|---|---|---|---|
| Clinton E Rowe Ret | -- | -- | |
| Rowe Clinton E | $685,000 | -- |
| Date | Status | Borrower | Loan Amount |
|---|---|---|---|
| Previous Owner | Rowe Clinton E | $417,000 |
| Date | Event | Price | List to Sale | Price per Sq Ft |
|---|---|---|---|---|
| 11/17/2025 11/17/25 | Rented | $4,750 | 0.0% | -- |
| 11/11/2025 11/11/25 | For Rent | $4,750 | +4.4% | -- |
| 10/15/2025 10/15/25 | For Rent | $4,550 | -9.0% | -- |
| 10/16/2023 10/16/23 | Price Changed | $5,000 | +13.6% | $7 / Sq Ft |
| 10/14/2023 10/14/23 | Under Contract | -- | -- | -- |
| 10/14/2023 10/14/23 | Rented | $4,400 | 0.0% | -- |
| 10/03/2023 10/03/23 | Price Changed | $4,400 | 0.0% | $6 / Sq Ft |
| 10/03/2023 10/03/23 | For Rent | $4,400 | -8.3% | -- |
| 09/30/2023 09/30/23 | Off Market | $4,800 | -- | -- |
| 09/06/2023 09/06/23 | Price Changed | $4,800 | -4.0% | $7 / Sq Ft |
| 08/11/2023 08/11/23 | For Rent | $5,000 | +35.1% | -- |
| 06/30/2021 06/30/21 | Rented | $3,700 | -2.6% | -- |
| 06/25/2021 06/25/21 | Under Contract | -- | -- | -- |
| 03/23/2021 03/23/21 | Price Changed | $3,800 | +8.6% | $5 / Sq Ft |
| 03/03/2021 03/03/21 | For Rent | $3,500 | 0.0% | -- |
| 02/28/2021 02/28/21 | Off Market | $3,500 | -- | -- |
| 01/17/2021 01/17/21 | Price Changed | $3,500 | -12.5% | $5 / Sq Ft |
| 11/23/2020 11/23/20 | For Rent | $4,000 | -11.1% | -- |
| 08/11/2018 08/11/18 | Rented | $4,500 | 0.0% | -- |
| 08/09/2018 08/09/18 | Under Contract | -- | -- | -- |
| 07/27/2018 07/27/18 | For Rent | $4,500 | -- | -- |
| Year | Tax Paid | Tax Assessment Tax Assessment Total Assessment is a certain percentage of the fair market value that is determined by local assessors to be the total taxable value of land and additions on the property. | Land | Improvement |
|---|---|---|---|---|
| 2025 | $15,509 | $1,339,300 | $0 | $1,339,300 |
| 2024 | $13,188 | $1,209,900 | $0 | $1,209,900 |
| 2023 | $12,735 | $1,185,800 | $0 | $1,185,800 |
| 2022 | $12,776 | $1,174,300 | $0 | $1,174,300 |
| 2021 | $12,283 | $1,151,200 | $0 | $1,151,200 |
| 2020 | $11,504 | $1,089,400 | $0 | $1,089,400 |
| 2019 | $11,146 | $1,057,500 | $0 | $1,057,500 |
| 2018 | $11,465 | $1,094,000 | $0 | $1,094,000 |
| 2017 | $11,034 | $1,041,900 | $0 | $1,041,900 |
| 2016 | $10,101 | $918,300 | $0 | $918,300 |
| 2015 | $10,027 | $828,000 | $0 | $828,000 |
| 2014 | $8,532 | $678,200 | $0 | $678,200 |
J
Seller's Agent in 2025
Joseph Baglio
Back Bay Residential
(617) 669-4414
3 in this area
4 Total Sales
G
Seller's Agent in 2023
Gyokubai Kin
M & Y Realty

Buyer's Agent in 2021
The Biega + Kilgore Team
Compass
(617) 504-7814
44 in this area
265 Total Sales
Seller's Agent in 2018
Ethan Felleman
Gibson Sothebys International Realty
(617) 426-6900
2 in this area
17 Total Sales