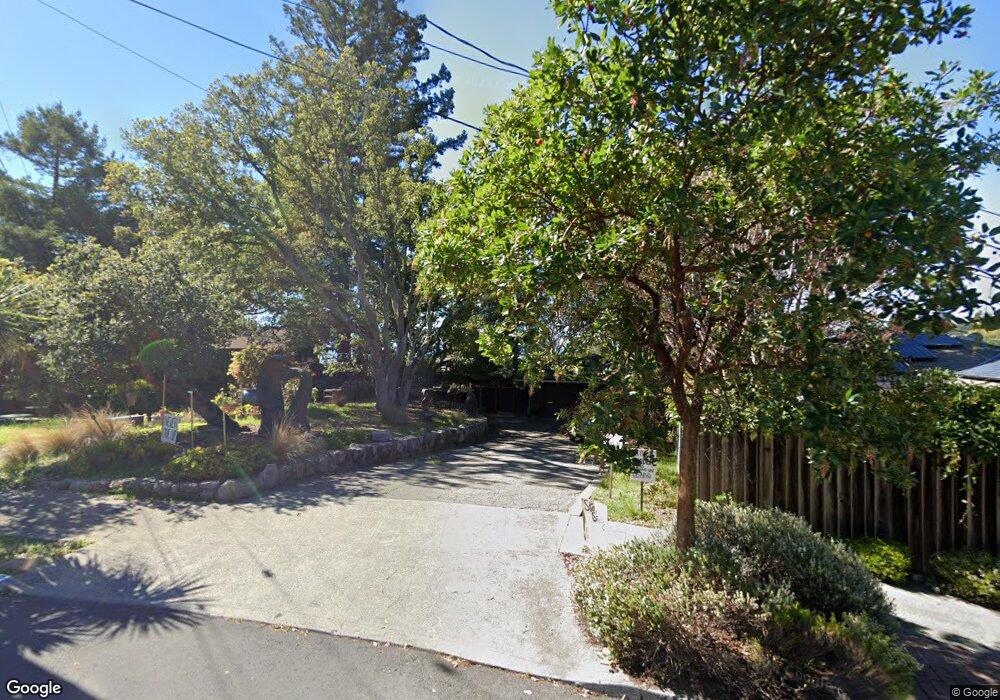
400 Vermont Ave Berkeley, CA 94707
Estimated Value: $1,594,000 - $2,620,000
4
Beds
3
Baths
3,307
Sq Ft
$672/Sq Ft
Est. Value
About This Home
This home is located at 400 Vermont Ave, Berkeley, CA 94707 and is currently estimated at $2,222,604, approximately $672 per square foot. 400 Vermont Ave is a home located in Alameda County with nearby schools including Thousand Oaks Elementary School, Ruth Acty Elementary, and Berkeley Arts Magnet at Whittier School.
Ownership History
Date
Name
Owned For
Owner Type
Purchase Details
Closed on
May 4, 2022
Sold by
Lowell Waters Brook Family Trust and Brook Lowell W
Bought by
Lowell Waters Brook Family Trust and Brook
Current Estimated Value
Purchase Details
Closed on
May 29, 2014
Sold by
Brook Lowell W
Bought by
Brook Lowell W and Lowell Waters Brook Family Tru
Purchase Details
Closed on
Apr 9, 2014
Sold by
Brown Karen L and Brown Family Trust
Bought by
Brook Lowell W
Purchase Details
Closed on
Jun 12, 2006
Sold by
Kazanski Claude and Leopold Madeline
Bought by
Brown David A and Brown Family Trust
Purchase Details
Closed on
Sep 22, 2004
Sold by
Leopold Luna Bergere and The Luna & Barbara Leopold Fam
Bought by
Leopold Luna Bergere and Bypass Trust Of The Luna & Bar
Purchase Details
Closed on
Dec 20, 1996
Sold by
Leopold Luna B and Leopold Barbara B
Bought by
Beck Leopold Luna Bergere and Beck Leopold Barbara
Create a Home Valuation Report for This Property
The Home Valuation Report is an in-depth analysis detailing your home's value as well as a comparison with similar homes in the area
Home Values in the Area
Average Home Value in this Area
Purchase History
| Date | Buyer | Sale Price | Title Company |
|---|---|---|---|
| Lowell Waters Brook Family Trust | -- | None Listed On Document | |
| Brook Lowell W | -- | None Available | |
| Brook Lowell W | -- | None Available | |
| Brown David A | $900,000 | First American Title Co | |
| Leopold Luna Bergere | -- | -- | |
| Leopold Luna Bergere | -- | -- | |
| Beck Leopold Luna Bergere | -- | -- |
Source: Public Records
Tax History
| Year | Tax Paid | Tax Assessment Tax Assessment Total Assessment is a certain percentage of the fair market value that is determined by local assessors to be the total taxable value of land and additions on the property. | Land | Improvement |
|---|---|---|---|---|
| 2025 | $11,794 | $569,504 | $172,951 | $403,553 |
| 2024 | $11,794 | $558,202 | $169,560 | $395,642 |
| 2023 | $11,505 | $554,122 | $166,236 | $387,886 |
| 2022 | $11,220 | $536,259 | $162,977 | $380,282 |
| 2021 | $11,194 | $525,610 | $159,783 | $372,827 |
| 2020 | $10,442 | $527,151 | $158,145 | $369,006 |
| 2019 | $9,861 | $516,818 | $155,045 | $361,773 |
| 2018 | $9,648 | $506,689 | $152,006 | $354,683 |
| 2017 | $9,294 | $496,758 | $149,027 | $347,731 |
| 2016 | $8,881 | $487,020 | $146,106 | $340,914 |
| 2015 | $8,740 | $479,708 | $143,912 | $335,796 |
| 2014 | $8,406 | $470,313 | $141,094 | $329,219 |
Source: Public Records
Map
Nearby Homes
- 380 Vermont Ave
- 450 Vermont Ave
- 483 Boynton Ave
- 589 San Luis Rd
- 255 Stanford Ave
- 470 Spruce St
- 201 Amherst Ave
- 249 Trinity Ave
- 290 Colgate Ave
- 410 Grizzly Peak Blvd
- 491 Vincente Ave
- 614 Cragmont Ave
- 260 Grizzly Peak Blvd
- 543 Grizzly Peak Blvd
- 765 San Diego Rd
- 1983 Yosemite Rd
- 606 Grizzly Peak Blvd
- 49 Windsor Ave
- 758 Spruce St
- 1858 San Lorenzo Ave
- 402 Vermont Ave
- 390 Vermont Ave
- 431 Boynton Ave
- 427 Boynton Ave
- 433 Boynton Ave
- 18 Yale Cir
- 404 Vermont Ave
- 386 Vermont Ave
- 17 Yale Cir
- 435 Boynton Ave
- 16 Yale Cir
- 423 Boynton Ave
- 408 Vermont Ave
- 326 Rugby Ave
- 401 Vermont Ave
- 439 Boynton Ave
- 419 Boynton Ave
- 409 Vermont Ave
- 15 Yale Cir
- 416 Vermont Ave
Your Personal Tour Guide
Ask me questions while you tour the home.