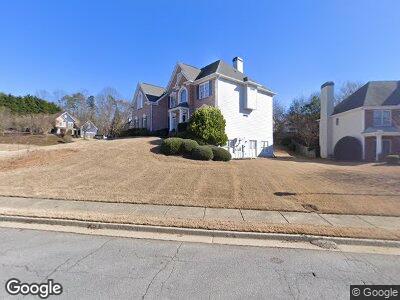
4000 Lost Oak Ct Unit 1 Buford, GA 30519
Estimated Value: $614,233 - $671,000
4
Beds
3
Baths
3,261
Sq Ft
$195/Sq Ft
Est. Value
About This Home
This home is located at 4000 Lost Oak Ct Unit 1, Buford, GA 30519 and is currently estimated at $637,308, approximately $195 per square foot. 4000 Lost Oak Ct Unit 1 is a home located in Gwinnett County with nearby schools including Harmony Elementary School, Glenn C. Jones Middle School, and Sugar Hill Christian Academy.
Ownership History
Date
Name
Owned For
Owner Type
Purchase Details
Closed on
Sep 10, 2002
Sold by
Greenwalt Bryan
Bought by
Nail Joanne O
Current Estimated Value
Home Financials for this Owner
Home Financials are based on the most recent Mortgage that was taken out on this home.
Original Mortgage
$254,700
Interest Rate
4.5%
Mortgage Type
New Conventional
Purchase Details
Closed on
Aug 29, 2002
Sold by
Greenwalt Kelly
Bought by
Greenwalt Bryan
Home Financials for this Owner
Home Financials are based on the most recent Mortgage that was taken out on this home.
Original Mortgage
$254,700
Interest Rate
4.5%
Mortgage Type
New Conventional
Purchase Details
Closed on
Oct 25, 2001
Sold by
Greenwalt Bryan
Bought by
Greenwalt Bryan and Greenwalt Kelly
Home Financials for this Owner
Home Financials are based on the most recent Mortgage that was taken out on this home.
Original Mortgage
$247,390
Interest Rate
6.67%
Mortgage Type
New Conventional
Create a Home Valuation Report for This Property
The Home Valuation Report is an in-depth analysis detailing your home's value as well as a comparison with similar homes in the area
Home Values in the Area
Average Home Value in this Area
Purchase History
| Date | Buyer | Sale Price | Title Company |
|---|---|---|---|
| Nail Joanne O | $283,000 | -- | |
| Greenwalt Bryan | -- | -- | |
| Greenwalt Bryan | -- | -- | |
| Greenwalt Bryan | $264,400 | -- |
Source: Public Records
Mortgage History
| Date | Status | Borrower | Loan Amount |
|---|---|---|---|
| Open | Nail Joanne O | $294,679 | |
| Closed | Nail Joanne O | $268,111 | |
| Closed | Nail Joanne O | $244,000 | |
| Closed | Nail Joanne O | $45,750 | |
| Closed | Nail Joanne O | $254,700 | |
| Previous Owner | Greenwalt Bryan | $247,390 |
Source: Public Records
Tax History Compared to Growth
Tax History
| Year | Tax Paid | Tax Assessment Tax Assessment Total Assessment is a certain percentage of the fair market value that is determined by local assessors to be the total taxable value of land and additions on the property. | Land | Improvement |
|---|---|---|---|---|
| 2023 | $1,795 | $197,080 | $33,600 | $163,480 |
| 2022 | $1,756 | $197,080 | $33,600 | $163,480 |
| 2021 | $1,739 | $145,040 | $29,600 | $115,440 |
| 2020 | $1,737 | $145,040 | $29,600 | $115,440 |
| 2019 | $1,596 | $133,360 | $26,400 | $106,960 |
| 2018 | $1,577 | $133,360 | $26,400 | $106,960 |
| 2016 | $1,610 | $128,720 | $26,400 | $102,320 |
| 2015 | $1,644 | $119,440 | $18,400 | $101,040 |
| 2014 | -- | $110,080 | $18,400 | $91,680 |
Source: Public Records
Map
Nearby Homes
- 2499 E Maddox Rd
- 3874 Lost Oak Dr
- 2346 E Maddox Rd
- 2727 Lost Mill Trace
- 2398 E Maddox Rd
- 3634 Lost Oak Dr
- 4010 Hamilton Mill Rd
- 3705 Rolling Creek Dr
- 2466 Thrasher Rd
- 3641 Devenwood Way
- 3828 Morning Meadow Ln
- 2262 Silver Fox Ln
- 3643 Southland Dr NE
- 4020 Inman Park Ln
- 4238 Hamilton Mill Rd
- 2585 Chandler Grove Dr
- 4000 Lost Oak Ct Unit 1
- 3980 3980
- 3953 Lost Oak Dr
- 3980 Lost Oak Ct
- 4005 Lost Oak Ct Unit 1
- 3964 Lost Oak Dr
- 3954 Lost Oak Dr Unit 1
- 3960 Lost Oak Ct Unit 18
- 3960 Lost Oak Ct Unit 2
- 3960 Lost Oak Ct
- 3943 Lost Oak Dr 0
- 3943 Lost Oak Drive 0
- 3943 Lost Oak Dr NE
- 3995 Lost Oak Ct
- 3974 Lost Oak Dr
- 0 Lost Oak Dr 0 Unit 8625902
- 3984 Lost Oak Dr
- 3944 Lost Oak Dr
- 3993 Lost Oak Dr
- 3950 Lost Oak Ct