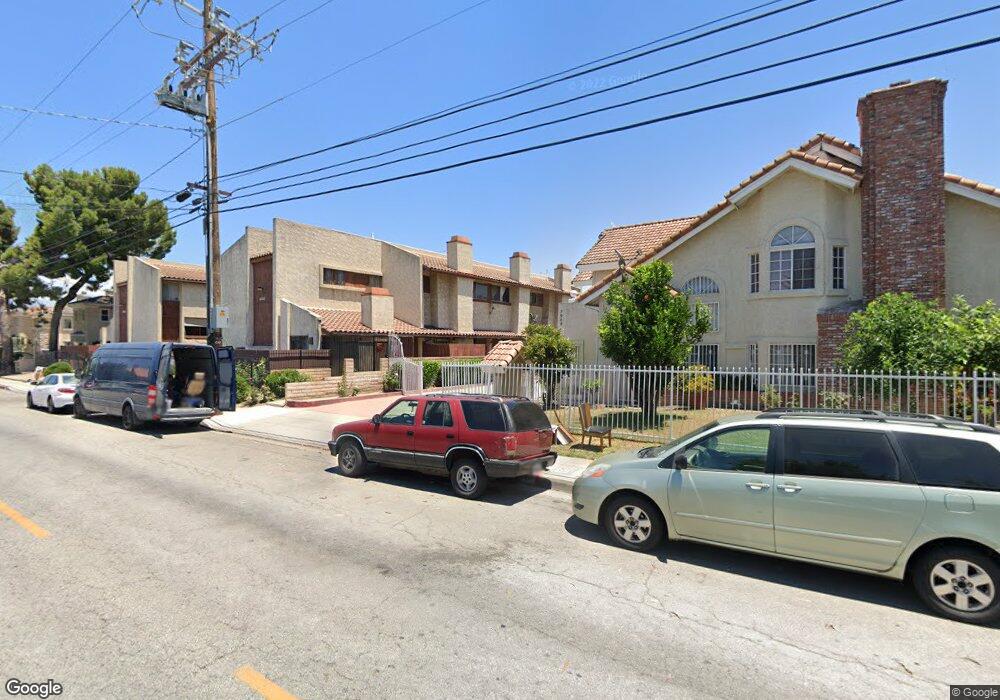
4002 Maxson Rd Unit 19 El Monte, CA 91732
River East NeighborhoodEstimated Value: $614,000 - $648,897
3
Beds
3
Baths
1,573
Sq Ft
$401/Sq Ft
Est. Value
About This Home
This home is located at 4002 Maxson Rd Unit 19, El Monte, CA 91732 and is currently estimated at $630,224, approximately $400 per square foot. 4002 Maxson Rd Unit 19 is a home located in Los Angeles County with nearby schools including La Primaria Elementary School and Mountain View High.
Ownership History
Date
Name
Owned For
Owner Type
Purchase Details
Closed on
Jan 6, 2025
Sold by
Diep Le Hue and Thai Le Hue
Bought by
Le Hue Diep Thai Family Trust and Thai
Current Estimated Value
Purchase Details
Closed on
Jun 27, 2000
Sold by
Tu Tu Ha Ha
Bought by
Thai Hao Phu
Home Financials for this Owner
Home Financials are based on the most recent Mortgage that was taken out on this home.
Original Mortgage
$45,000
Interest Rate
8.63%
Purchase Details
Closed on
Mar 16, 1998
Sold by
Kong Bryan Sun Kit and Kong Judy Wan Cum
Bought by
Ha Tu Tu
Home Financials for this Owner
Home Financials are based on the most recent Mortgage that was taken out on this home.
Original Mortgage
$73,600
Interest Rate
7.17%
Purchase Details
Closed on
Mar 15, 1994
Sold by
Wong Edward and Wong James
Bought by
Wong Edward
Create a Home Valuation Report for This Property
The Home Valuation Report is an in-depth analysis detailing your home's value as well as a comparison with similar homes in the area
Home Values in the Area
Average Home Value in this Area
Purchase History
| Date | Buyer | Sale Price | Title Company |
|---|---|---|---|
| Le Hue Diep Thai Family Trust | -- | None Listed On Document | |
| Thai Hao Phu | $113,000 | American Title Co | |
| Ha Tu Tu | -- | Fidelity National Title Co | |
| Wong Edward | -- | -- |
Source: Public Records
Mortgage History
| Date | Status | Borrower | Loan Amount |
|---|---|---|---|
| Previous Owner | Thai Hao Phu | $45,000 | |
| Previous Owner | Ha Tu Tu | $73,600 |
Source: Public Records
Tax History
| Year | Tax Paid | Tax Assessment Tax Assessment Total Assessment is a certain percentage of the fair market value that is determined by local assessors to be the total taxable value of land and additions on the property. | Land | Improvement |
|---|---|---|---|---|
| 2025 | $2,518 | $169,949 | $49,413 | $120,536 |
| 2024 | $2,518 | $166,618 | $48,445 | $118,173 |
| 2023 | $2,475 | $163,352 | $47,496 | $115,856 |
| 2022 | $2,383 | $160,150 | $46,565 | $113,585 |
| 2021 | $2,423 | $157,010 | $45,652 | $111,358 |
| 2019 | $2,350 | $152,355 | $44,299 | $108,056 |
| 2018 | $2,249 | $149,369 | $43,431 | $105,938 |
| 2016 | $2,066 | $143,571 | $41,746 | $101,825 |
| 2015 | $2,042 | $141,415 | $41,119 | $100,296 |
| 2014 | $2,004 | $138,646 | $40,314 | $98,332 |
Source: Public Records
Map
Nearby Homes
- 3957 Durfee Ave
- 4042 Maxson Rd Unit C
- 3840 Durfee Ave
- 3903 Gilman Rd
- 12343 Deana St
- 2720 2724 Durfee Ave
- 12141 Ramona Blvd
- 3629 Ponderosa St
- 3554 Durfee Ave
- 3595 Windsong St
- 11919 Deana St Unit B
- 12122 Ferris Rd Unit 1
- 11834 Kerrwood St
- 12541 Pinehurst St
- 3462 Durfee Ave
- 12557 Pinehurst St
- 11825 Basye St
- 3548 Whistler Ave
- 4404 Cogswell Rd
- 12118 Killian St
- 4002 Maxson Rd Unit 17
- 4002 Maxson Rd
- 4002 Maxson Rd Unit 10
- 4002 Maxson Rd Unit 9
- 4002 Maxson Rd Unit 8
- 4002 Maxson Rd Unit 7
- 4002 Maxson Rd Unit 6
- 4002 Maxson Rd Unit 5
- 4002 Maxson Rd Unit 4
- 4002 Maxson Rd Unit 3
- 4002 Maxson Rd Unit 2
- 4002 Maxson Rd Unit 1
- 4002 Maxson Rd Unit 20
- 4002 Maxson Rd Unit 18
- 4002 Maxson Rd Unit 17
- 4002 Maxson Rd Unit 16
- 4002 Maxson Rd Unit 15
- 4002 Maxson Rd Unit 14
- 4002 Maxson Rd Unit 13
- 4002 Maxson Rd Unit 12
Your Personal Tour Guide
Ask me questions while you tour the home.