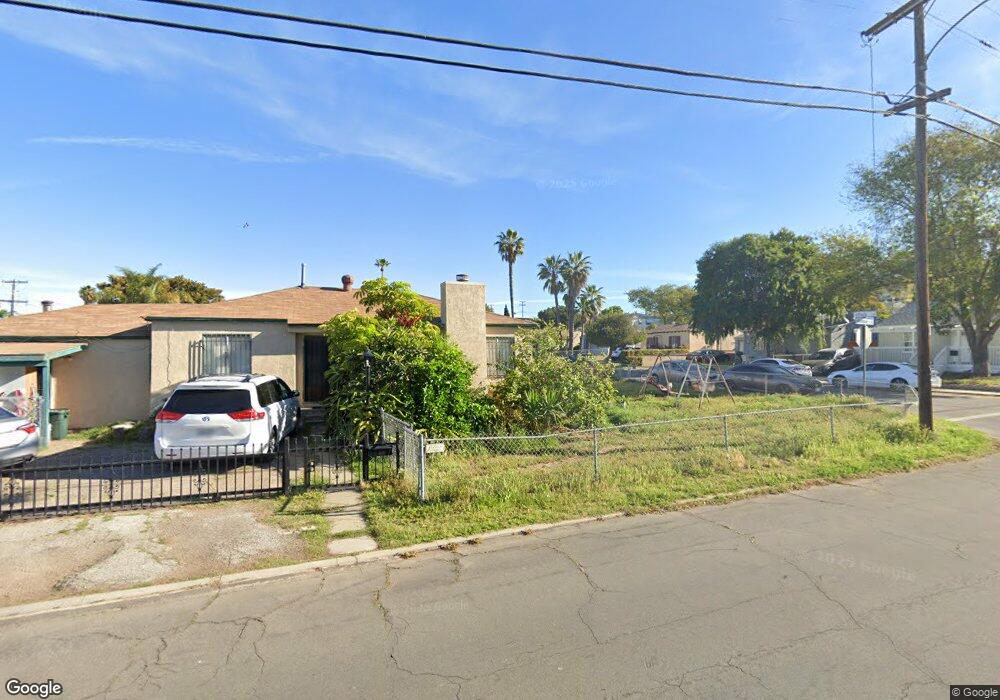
4002 Paula St La Mesa, CA 91941
Estimated Value: $747,000 - $894,000
4
Beds
2
Baths
1,633
Sq Ft
$496/Sq Ft
Est. Value
About This Home
This home is located at 4002 Paula St, La Mesa, CA 91941 and is currently estimated at $810,430, approximately $496 per square foot. 4002 Paula St is a home located in San Diego County with nearby schools including Vista La Mesa Academy, Mount Miguel High School, and Helix High School.
Ownership History
Date
Name
Owned For
Owner Type
Purchase Details
Closed on
Jun 21, 1999
Sold by
Swjt Stark David A and Brady Mary F
Bought by
Lam Henry and Lam Fiona
Current Estimated Value
Purchase Details
Closed on
May 14, 1998
Sold by
Va
Bought by
Stark David A and Brady Mary F
Home Financials for this Owner
Home Financials are based on the most recent Mortgage that was taken out on this home.
Original Mortgage
$136,000
Interest Rate
7.13%
Mortgage Type
Seller Take Back
Purchase Details
Closed on
Jul 30, 1997
Sold by
Homeside Lending Inc
Bought by
Va
Purchase Details
Closed on
Jul 29, 1997
Sold by
Henderson Dwight A
Bought by
Homeside Lending Inc
Purchase Details
Closed on
Mar 1, 1994
Sold by
Dawson Margaret M
Bought by
Henderson Dwight A and Henderson Kelly
Home Financials for this Owner
Home Financials are based on the most recent Mortgage that was taken out on this home.
Original Mortgage
$138,210
Interest Rate
7.84%
Mortgage Type
VA
Create a Home Valuation Report for This Property
The Home Valuation Report is an in-depth analysis detailing your home's value as well as a comparison with similar homes in the area
Purchase History
| Date | Buyer | Sale Price | Title Company |
|---|---|---|---|
| Lam Henry | -- | American Title Ins Co | |
| Stark David A | $137,000 | First American Title | |
| Va | -- | First Southwestern Title Co | |
| Homeside Lending Inc | $114,127 | First Southwestern Title Co | |
| Henderson Dwight A | $135,500 | Commonwealth Land Title Co |
Source: Public Records
Mortgage History
| Date | Status | Borrower | Loan Amount |
|---|---|---|---|
| Previous Owner | Stark David A | $136,000 | |
| Previous Owner | Henderson Dwight A | $138,210 |
Source: Public Records
Tax History
| Year | Tax Paid | Tax Assessment Tax Assessment Total Assessment is a certain percentage of the fair market value that is determined by local assessors to be the total taxable value of land and additions on the property. | Land | Improvement |
|---|---|---|---|---|
| 2025 | $3,665 | $250,499 | $115,258 | $135,241 |
| 2024 | $3,665 | $245,589 | $112,999 | $132,590 |
| 2023 | $3,672 | $240,775 | $110,784 | $129,991 |
| 2022 | $3,675 | $236,055 | $108,612 | $127,443 |
| 2021 | $3,612 | $231,428 | $106,483 | $124,945 |
| 2020 | $3,607 | $229,056 | $105,392 | $123,664 |
| 2019 | $3,540 | $224,566 | $103,326 | $121,240 |
| 2018 | $3,439 | $220,163 | $101,300 | $118,863 |
| 2017 | $50 | $215,847 | $99,314 | $116,533 |
| 2016 | $3,280 | $211,616 | $97,367 | $114,249 |
| 2015 | $3,268 | $208,438 | $95,905 | $112,533 |
| 2014 | $3,133 | $204,356 | $94,027 | $110,329 |
Source: Public Records
Map
Nearby Homes
- 4003 Paula St
- 7216 Pearson St
- 3892 Bass St
- 7125 Waite Dr
- 7104 Hybeth Dr
- 4040 Apore St
- 7320 Sono Place
- 4227 69th St
- 6844 Missy Ct
- 4245 69th St
- 4224 69th St
- 3979 Aragon Dr
- 4036 Loma Alta Dr
- 4349 Yale Ave
- 4350 68th St
- 4281 Lowell St Unit 24
- 4231 Lowell St Unit 14
- 7118 Stanford Ave
- 3156 Massachusetts Ave Unit 5
- 6650 Vigo Dr
Your Personal Tour Guide
Ask me questions while you tour the home.