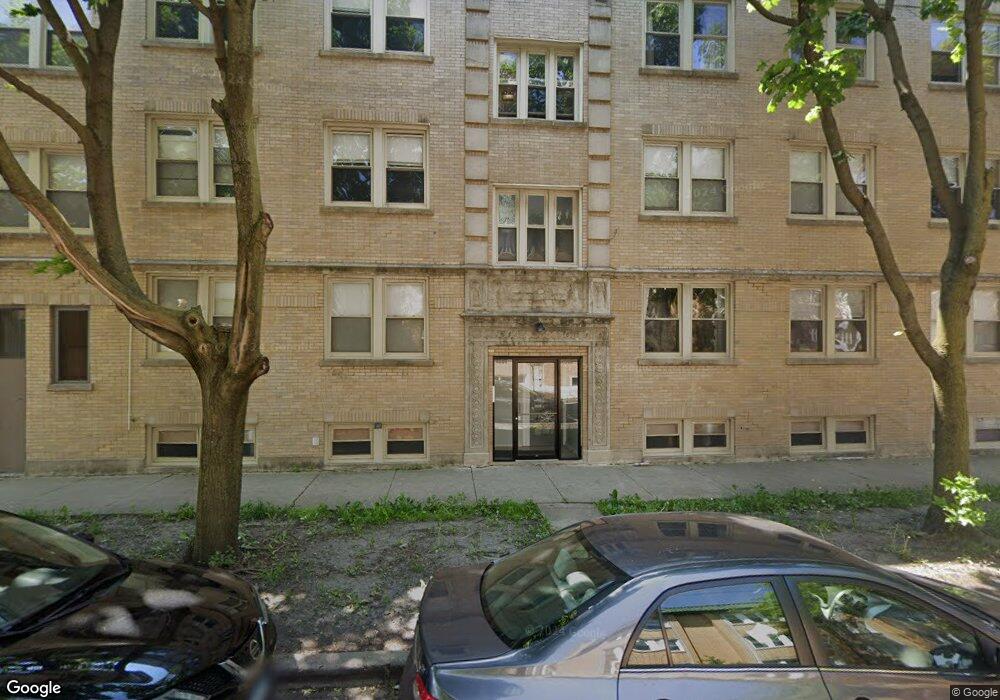
4005 W Wellington Ave Unit 4005 Chicago, IL 60641
Avondale NeighborhoodEstimated Value: $114,298 - $198,000
1
Bed
1
Bath
27,120
Sq Ft
$5/Sq Ft
Est. Value
About This Home
This home is located at 4005 W Wellington Ave Unit 4005, Chicago, IL 60641 and is currently estimated at $143,325, approximately $5 per square foot. 4005 W Wellington Ave Unit 4005 is a home located in Cook County with nearby schools including Garcia Lorca Elementary School, Schurz High School, and ASPIRA Early College High School.
Ownership History
Date
Name
Owned For
Owner Type
Purchase Details
Closed on
Jan 16, 2018
Sold by
Chi 4005 Llc
Bought by
Standard Properties Corporation
Current Estimated Value
Purchase Details
Closed on
Jan 9, 2015
Sold by
Community Initiatives Inc
Bought by
Tbi Urban Holdings Llc
Purchase Details
Closed on
Jun 7, 2013
Sold by
Wellington & Pulaski Condominium Associa
Bought by
Chi4005 Llc
Purchase Details
Closed on
Jun 6, 2013
Sold by
Chicago Properties Express
Bought by
Wellington & Pulaski Condominium Associa
Purchase Details
Closed on
Aug 30, 2011
Sold by
Belmont Bank & Trust Company
Bought by
Chicago Properties Express
Purchase Details
Closed on
Nov 24, 2008
Sold by
3731 N St Louis Llc
Bought by
Belmont Bank & Trust Company
Create a Home Valuation Report for This Property
The Home Valuation Report is an in-depth analysis detailing your home's value as well as a comparison with similar homes in the area
Home Values in the Area
Average Home Value in this Area
Purchase History
| Date | Buyer | Sale Price | Title Company |
|---|---|---|---|
| Standard Properties Corporation | -- | First American Title Insuran | |
| Tbi Urban Holdings Llc | -- | None Available | |
| Chi4005 Llc | $35,000 | None Available | |
| Wellington & Pulaski Condominium Associa | -- | None Available | |
| Chicago Properties Express | -- | None Available | |
| Belmont Bank & Trust Company | -- | None Available |
Source: Public Records
Tax History Compared to Growth
Tax History
| Year | Tax Paid | Tax Assessment Tax Assessment Total Assessment is a certain percentage of the fair market value that is determined by local assessors to be the total taxable value of land and additions on the property. | Land | Improvement |
|---|---|---|---|---|
| 2024 | $529 | $9,402 | $827 | $8,575 |
| 2023 | $516 | $2,500 | $872 | $1,628 |
| 2022 | $516 | $2,500 | $872 | $1,628 |
| 2021 | $504 | $2,499 | $871 | $1,628 |
| 2020 | $606 | $2,709 | $386 | $2,323 |
| 2019 | $615 | $3,048 | $386 | $2,662 |
| 2018 | $602 | $3,048 | $386 | $2,662 |
| 2017 | $665 | $3,087 | $346 | $2,741 |
| 2016 | $764 | $3,814 | $346 | $3,468 |
| 2015 | $699 | $3,814 | $346 | $3,468 |
| 2014 | $2,165 | $11,668 | $320 | $11,348 |
| 2013 | $2,122 | $11,668 | $320 | $11,348 |
Source: Public Records
Map
Nearby Homes
- 4006 W Wellington Ave Unit 3
- 4044 W Wellington Ave
- 4100 W George St
- 3080 N Davlin Ct
- 2957 N Avers Ave
- 2857 N Avers Ave
- 3963 W Belmont Ave Unit 336
- 3963 W Belmont Ave Unit 222
- 4452-54 N Harding Ave
- 3071 N Avers Ave
- 2733 N Pulaski Rd
- 4183 W Nelson St
- 4131 W Belmont Ave Unit 318
- 2742 N Hamlin Ave Unit 3N
- 2837 N Ridgeway Ave
- 3278 N Milwaukee Ave
- 3101 N Ridgeway Ave Unit 2E
- 3847 W School St
- 4206 W Belmont Ave
- 4125 W School St
- 4009 W Wellington Ave Unit 4009
- 4009 W Wellington Ave Unit 4009
- 4009 W Wellington Ave Unit 40093
- 4009 W Wellington Ave Unit 3
- 4009 W Wellington Ave Unit 1
- 4007 W Wellington Ave Unit 4007
- 4007 W Wellington Ave Unit 4007
- 4007 W Wellington Ave Unit 4007
- 4007 W Wellington Ave Unit 3
- 4007 W Wellington Ave Unit 2
- 4007 W Wellington Ave Unit 1
- 4003 W Wellington Ave Unit 4003
- 4003 W Wellington Ave Unit 4003
- 4003 W Wellington Ave Unit 1
- 4003 W Wellington Ave Unit 3
- 4003 W Wellington Ave Unit 2
- 2954 N Pulaski Rd Unit 1-3
- 2958 N Pulaski Rd Unit 29582
- 2958 N Pulaski Rd Unit 2
- 2958 N Pulaski Rd Unit 3