4007 320th St Mapleton, IA 51034
Estimated Value: $193,000 - $282,317
2
Beds
2
Baths
1,600
Sq Ft
$146/Sq Ft
Est. Value
About This Home
This home is located at 4007 320th St, Mapleton, IA 51034 and is currently estimated at $234,079, approximately $146 per square foot. 4007 320th St is a home located in Woodbury County with nearby schools including Anthon Elementary School, Mvao Middle School, and Maple Valley-Anthon Oto High School.
Ownership History
Date
Name
Owned For
Owner Type
Purchase Details
Closed on
Mar 30, 2019
Sold by
Weber Frank W and Weber Leona M
Bought by
Eckert Aaron J and Eckert Brittany K
Current Estimated Value
Home Financials for this Owner
Home Financials are based on the most recent Mortgage that was taken out on this home.
Original Mortgage
$130,800
Outstanding Balance
$114,050
Interest Rate
4.3%
Mortgage Type
Balloon
Estimated Equity
$120,029
Purchase Details
Closed on
Jun 27, 2015
Sold by
Dose Steven R and Dose Catherine A
Bought by
Weber Frank W and Weber Leona M
Create a Home Valuation Report for This Property
The Home Valuation Report is an in-depth analysis detailing your home's value as well as a comparison with similar homes in the area
Purchase History
| Date | Buyer | Sale Price | Title Company |
|---|---|---|---|
| Eckert Aaron J | $132,768 | -- | |
| Weber Frank W | $160,000 | None Available |
Source: Public Records
Mortgage History
| Date | Status | Borrower | Loan Amount |
|---|---|---|---|
| Open | Eckert Aaron J | $130,800 |
Source: Public Records
Tax History
| Year | Tax Paid | Tax Assessment Tax Assessment Total Assessment is a certain percentage of the fair market value that is determined by local assessors to be the total taxable value of land and additions on the property. | Land | Improvement |
|---|---|---|---|---|
| 2025 | $1,818 | $211,520 | $45,600 | $165,920 |
| 2024 | $18 | $175,740 | $30,000 | $145,740 |
| 2023 | $1,632 | $175,740 | $30,000 | $145,740 |
| 2022 | $1,592 | $137,300 | $30,000 | $107,300 |
| 2021 | $1,592 | $137,300 | $30,000 | $107,300 |
| 2020 | $1,564 | $127,350 | $32,100 | $95,250 |
| 2019 | $1,442 | $127,350 | $32,100 | $95,250 |
| 2018 | $1,398 | $111,300 | $16,050 | $95,250 |
| 2017 | $1,398 | $111,300 | $16,050 | $95,250 |
| 2016 | $844 | $69,100 | $0 | $0 |
| 2015 | $819 | $65,590 | $7,720 | $57,870 |
| 2014 | $864 | $68,290 | $7,720 | $60,570 |
Source: Public Records
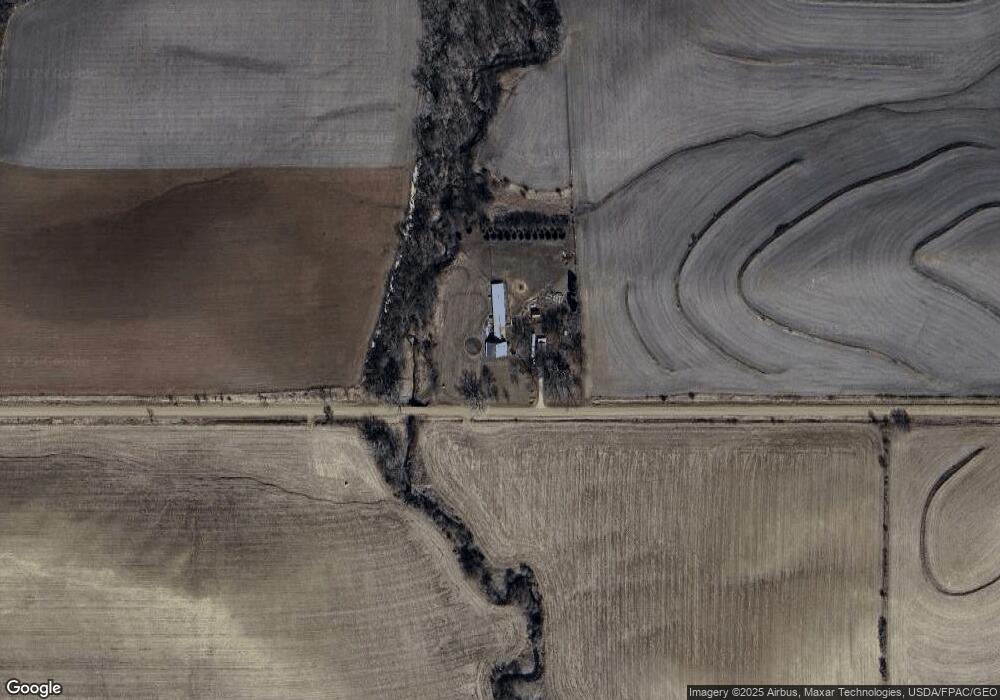
Map
Nearby Homes