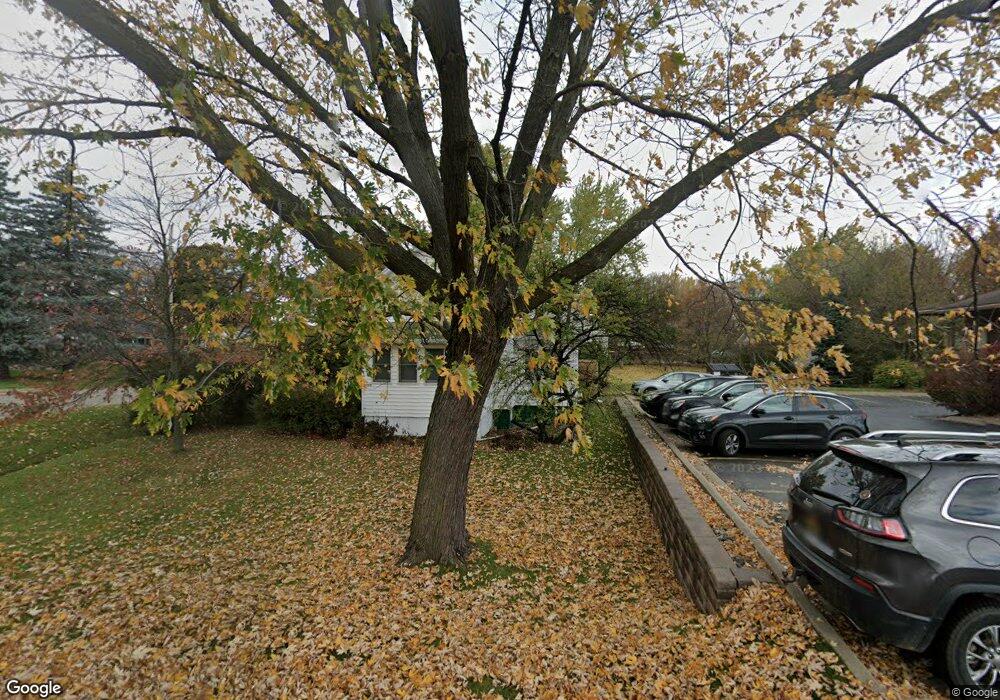
4008 W St Joe Hwy Lansing, MI 48917
Estimated Value: $134,000 - $179,734
2
Beds
2
Baths
1,026
Sq Ft
$156/Sq Ft
Est. Value
About This Home
This home is located at 4008 W St Joe Hwy, Lansing, MI 48917 and is currently estimated at $160,184, approximately $156 per square foot. 4008 W St Joe Hwy is a home located in Eaton County with nearby schools including Waverly Senior High School, Greater Lansing Adventist School, and Montessori Childrens House.
Ownership History
Date
Name
Owned For
Owner Type
Purchase Details
Closed on
May 22, 2019
Sold by
Kevelighan Hunter F and Kevelighan Tessa L
Bought by
Schlender Gary
Current Estimated Value
Home Financials for this Owner
Home Financials are based on the most recent Mortgage that was taken out on this home.
Original Mortgage
$89,910
Outstanding Balance
$58,524
Interest Rate
4.1%
Mortgage Type
New Conventional
Estimated Equity
$101,660
Purchase Details
Closed on
Apr 7, 2017
Sold by
Kevelighan Tammy
Bought by
Kevellghan Hunter F and Cox Tessa L
Home Financials for this Owner
Home Financials are based on the most recent Mortgage that was taken out on this home.
Original Mortgage
$72,659
Interest Rate
3.5%
Mortgage Type
FHA
Purchase Details
Closed on
Aug 12, 2016
Sold by
Woodruff Lawrence D
Bought by
Kevelighan Tammy
Purchase Details
Closed on
Nov 19, 2012
Sold by
Land Janice E and Land Ronald G
Bought by
Woodruff Lawrence D
Purchase Details
Closed on
Nov 16, 2012
Sold by
Brasser Kathryn L
Bought by
Woodruff Lawrence D
Create a Home Valuation Report for This Property
The Home Valuation Report is an in-depth analysis detailing your home's value as well as a comparison with similar homes in the area
Home Values in the Area
Average Home Value in this Area
Purchase History
| Date | Buyer | Sale Price | Title Company |
|---|---|---|---|
| Schlender Gary | $99,900 | None Available | |
| Kevellghan Hunter F | $74,000 | Attorney | |
| Kevelighan Tammy | $67,000 | Tri County Title Agency Llc | |
| Woodruff Lawrence D | -- | None Available | |
| Woodruff Lawrence D | -- | None Available | |
| Woodruff Lawrence D | $22,000 | None Available |
Source: Public Records
Mortgage History
| Date | Status | Borrower | Loan Amount |
|---|---|---|---|
| Open | Schlender Gary | $89,910 | |
| Previous Owner | Kevellghan Hunter F | $72,659 |
Source: Public Records
Tax History Compared to Growth
Tax History
| Year | Tax Paid | Tax Assessment Tax Assessment Total Assessment is a certain percentage of the fair market value that is determined by local assessors to be the total taxable value of land and additions on the property. | Land | Improvement |
|---|---|---|---|---|
| 2025 | $2,482 | $64,000 | $0 | $0 |
| 2024 | $1,428 | $62,400 | $0 | $0 |
| 2023 | $1,373 | $58,000 | $0 | $0 |
| 2022 | $2,163 | $54,000 | $0 | $0 |
| 2021 | $2,077 | $50,900 | $0 | $0 |
| 2020 | $2,189 | $47,500 | $0 | $0 |
| 2019 | $1,672 | $38,310 | $0 | $0 |
| 2018 | $1,645 | $36,600 | $0 | $0 |
| 2017 | $1,610 | $35,900 | $0 | $0 |
| 2016 | -- | $37,700 | $0 | $0 |
| 2015 | -- | $36,800 | $0 | $0 |
| 2014 | -- | $35,300 | $0 | $0 |
| 2013 | -- | $34,900 | $0 | $0 |
Source: Public Records
Map
Nearby Homes
- 612 S Dibble Blvd
- 516 Hume Blvd
- 918 Harvest Ln
- 3513 Jane Anne Terrace Unit 210
- 3707 W Michigan Ave
- 4616 W St Joe Hwy
- 210 Park Meadows Dr Unit 25
- 205 Renker Rd
- 1018 Pickton Dr
- 4819 Moultrie Cir
- 0000 N Dibble Ave
- 916 Westover Cir
- 215 Winifred Ave Unit A & B
- 4120 Arlene Dr
- 1109 Boulder Ct Unit 46
- 2805 W Washtenaw St
- 240 N Deerfield Ave
- 1130 Vail Ct Unit 25
- 531 Harriet Ave
- 2517 W Michigan Ave
- 4008 W St Jopseph Hwy
- 4008 W St Joseph Hwy
- 4008 W St Joseph
- 621 S Dibble Blvd
- 626 S Dibble Ave
- 621 S Dibble Ave
- 620 S Dibble Ave
- 617 S Dibble Ave
- 4000 W St Joe Hwy
- 620 S Dibble Blvd
- 4000 W Saint Joseph Hwy
- 610/612 Dibble Unit 2 Units
- 610/612 Dibble
- 642 Hume Blvd
- 607 S Dibble Ave
- 610 S Dibble Blvd
- 602 Hume Blvd
- 539 S Dibble Blvd
- 604 S Dibble Ave
- 539 S Dibble Ave