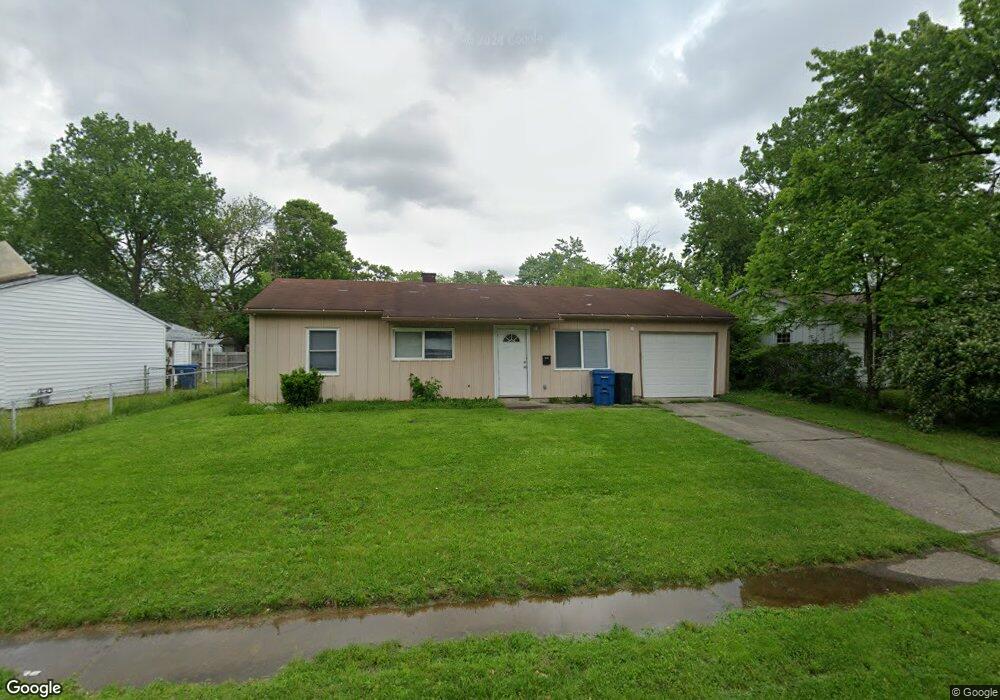
4009 Arborcrest Dr Indianapolis, IN 46226
Far Eastside NeighborhoodEstimated Value: $105,000 - $146,347
3
Beds
1
Bath
864
Sq Ft
$154/Sq Ft
Est. Value
About This Home
This home is located at 4009 Arborcrest Dr, Indianapolis, IN 46226 and is currently estimated at $133,087, approximately $154 per square foot. 4009 Arborcrest Dr is a home located in Marion County with nearby schools including Robert Lee Frost School 106, James Whitcomb Riley School 43, and Charles Warren Fairbanks School 105.
Ownership History
Date
Name
Owned For
Owner Type
Purchase Details
Closed on
May 20, 2014
Sold by
Rogers Derrick and Rogers Derrick T
Bought by
Rogers Derrick T and Rogers Nakiisa M
Current Estimated Value
Purchase Details
Closed on
May 15, 2012
Sold by
Centra Credit Union
Bought by
Rogers Derrick
Purchase Details
Closed on
Dec 31, 2011
Sold by
Spyder Properties Llc
Bought by
Centra Credit Union
Purchase Details
Closed on
Dec 10, 2008
Sold by
Federal Home Loan Mortgage Corporation
Bought by
Spyder Properties Llc
Home Financials for this Owner
Home Financials are based on the most recent Mortgage that was taken out on this home.
Original Mortgage
$22,500
Interest Rate
6.3%
Mortgage Type
Purchase Money Mortgage
Purchase Details
Closed on
Sep 24, 2008
Sold by
Whiteley Brian
Bought by
Federal Home Loan Mortgage Corp
Create a Home Valuation Report for This Property
The Home Valuation Report is an in-depth analysis detailing your home's value as well as a comparison with similar homes in the area
Home Values in the Area
Average Home Value in this Area
Purchase History
| Date | Buyer | Sale Price | Title Company |
|---|---|---|---|
| Rogers Derrick T | -- | None Available | |
| Rogers Derrick | -- | Security Title Services Llc | |
| Centra Credit Union | $46,471 | None Available | |
| Spyder Properties Llc | -- | None Available | |
| Federal Home Loan Mortgage Corp | $37,000 | None Available |
Source: Public Records
Mortgage History
| Date | Status | Borrower | Loan Amount |
|---|---|---|---|
| Previous Owner | Spyder Properties Llc | $22,500 |
Source: Public Records
Tax History Compared to Growth
Tax History
| Year | Tax Paid | Tax Assessment Tax Assessment Total Assessment is a certain percentage of the fair market value that is determined by local assessors to be the total taxable value of land and additions on the property. | Land | Improvement |
|---|---|---|---|---|
| 2024 | $1,978 | $85,600 | $9,300 | $76,300 |
| 2023 | $1,978 | $79,500 | $9,300 | $70,200 |
| 2022 | $1,826 | $71,200 | $9,300 | $61,900 |
| 2021 | $1,388 | $56,300 | $9,300 | $47,000 |
| 2020 | $1,159 | $46,300 | $5,100 | $41,200 |
| 2019 | $1,168 | $45,900 | $5,100 | $40,800 |
| 2018 | $1,038 | $40,100 | $5,100 | $35,000 |
| 2017 | $827 | $35,200 | $5,100 | $30,100 |
| 2016 | $784 | $34,000 | $5,100 | $28,900 |
| 2014 | $725 | $33,400 | $5,100 | $28,300 |
| 2013 | $1,448 | $33,400 | $5,100 | $28,300 |
Source: Public Records
Map
Nearby Homes
- 3851 Esquire Place
- 8303 E 42nd St
- 3976 Marseille Rd
- 3909 Richelieu Ct
- 3733 Harvest Ave
- 8136 E 37th Place
- 3851 Marseille Rd
- 8517 E 42nd St
- 8704 Montery Rd
- 8540 E 37th Place
- 4138 Balboa Dr
- 3710 Chateau Ct
- 3647 Richelieu Rd
- 3938 Biscayne Rd
- 3630 Alsace Dr
- 4248 Dubarry Rd
- 8514 E 36th Place
- 8434 Meadowlark Dr
- 3950 Malibu Ct
- 3544 Cecil Ave
- 4015 Arborcrest Dr
- 4001 Arborcrest Dr
- 4018 Alsace Place
- 4021 Arborcrest Dr
- 3985 Arborcrest Dr
- 4024 Alsace Place
- 4012 Alsace Place
- 3978 Arborcrest Dr
- 4027 Arborcrest Dr
- 3979 Arborcrest Dr
- 4030 Alsace Place
- 4004 Alsace Place
- 4002 Arborcrest Dr
- 4008 Arborcrest Dr
- 4014 Arborcrest Dr
- 4020 Arborcrest Dr
- 3980 Alsace Place
- 4033 Arborcrest Dr
- 4009 Alsace Place
- 4026 Arborcrest Dr