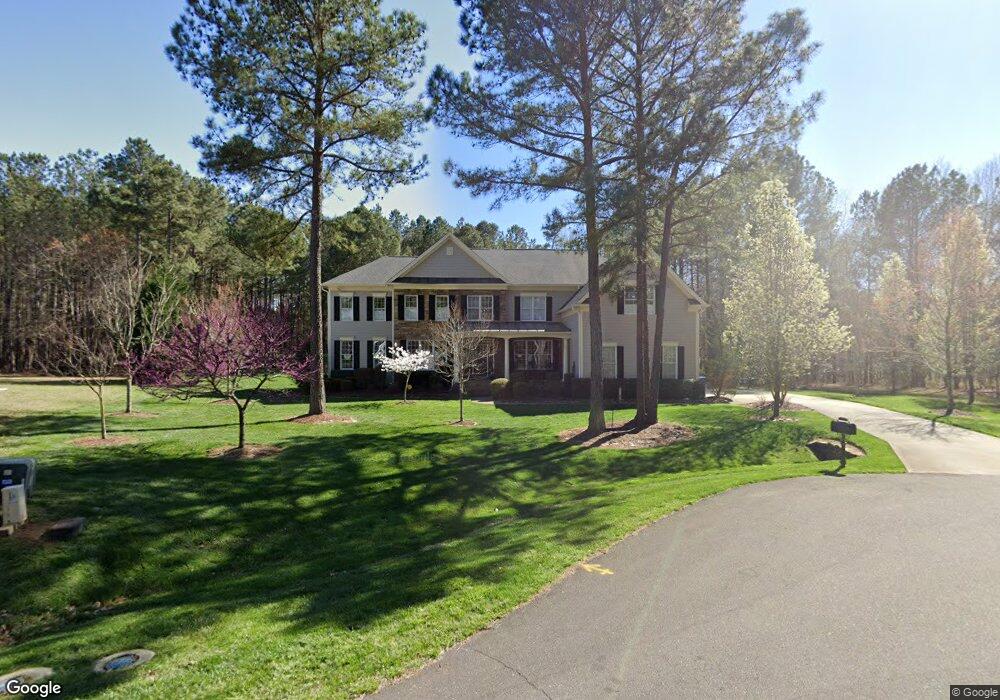
4009 Belmont Forest Way Raleigh, NC 27606
Middle Creek NeighborhoodEstimated Value: $1,238,000 - $1,529,000
4
Beds
5
Baths
5,660
Sq Ft
$240/Sq Ft
Est. Value
About This Home
This home is located at 4009 Belmont Forest Way, Raleigh, NC 27606 and is currently estimated at $1,358,436, approximately $240 per square foot. 4009 Belmont Forest Way is a home located in Wake County with nearby schools including Swift Creek Elementary School, Dillard Drive Magnet Middle School, and Resurrection Lutheran School.
Ownership History
Date
Name
Owned For
Owner Type
Purchase Details
Closed on
Mar 9, 2021
Sold by
Anderson Jennifer Lynn and Anderson Ryan Todd
Bought by
Anderson Ryan and Anderson Jennifer
Current Estimated Value
Purchase Details
Closed on
Jan 27, 2017
Sold by
Ambrosio Marc D and Ambrosio Pauline D
Bought by
Anderson Jennifer Lynn and Anderson Ryuan Todd
Home Financials for this Owner
Home Financials are based on the most recent Mortgage that was taken out on this home.
Original Mortgage
$350,000
Outstanding Balance
$176,593
Interest Rate
4.16%
Mortgage Type
New Conventional
Estimated Equity
$1,181,843
Purchase Details
Closed on
Aug 25, 2008
Sold by
Toll Nc Lp
Bought by
Dambrosio Marc and Dambrosio Pauline
Home Financials for this Owner
Home Financials are based on the most recent Mortgage that was taken out on this home.
Original Mortgage
$635,671
Interest Rate
6%
Mortgage Type
Purchase Money Mortgage
Create a Home Valuation Report for This Property
The Home Valuation Report is an in-depth analysis detailing your home's value as well as a comparison with similar homes in the area
Home Values in the Area
Average Home Value in this Area
Purchase History
| Date | Buyer | Sale Price | Title Company |
|---|---|---|---|
| Anderson Ryan | -- | None Available | |
| Anderson Jennifer Lynn | $175,000 | None Available | |
| Dambrosio Marc | $848,000 | None Available |
Source: Public Records
Mortgage History
| Date | Status | Borrower | Loan Amount |
|---|---|---|---|
| Open | Anderson Jennifer Lynn | $350,000 | |
| Previous Owner | Dambrosio Marc | $635,671 |
Source: Public Records
Tax History Compared to Growth
Tax History
| Year | Tax Paid | Tax Assessment Tax Assessment Total Assessment is a certain percentage of the fair market value that is determined by local assessors to be the total taxable value of land and additions on the property. | Land | Improvement |
|---|---|---|---|---|
| 2025 | $7,252 | $1,130,723 | $187,000 | $943,723 |
| 2024 | $7,042 | $1,130,723 | $187,000 | $943,723 |
| 2023 | $5,879 | $751,384 | $110,000 | $641,384 |
| 2022 | $5,446 | $751,384 | $110,000 | $641,384 |
| 2021 | $5,300 | $751,384 | $110,000 | $641,384 |
| 2020 | $5,212 | $751,384 | $110,000 | $641,384 |
| 2019 | $5,282 | $644,332 | $110,000 | $534,332 |
| 2018 | $4,855 | $644,332 | $110,000 | $534,332 |
| 2017 | $4,601 | $644,332 | $110,000 | $534,332 |
| 2016 | $4,508 | $644,332 | $110,000 | $534,332 |
| 2015 | $4,993 | $715,997 | $120,000 | $595,997 |
| 2014 | -- | $715,997 | $120,000 | $595,997 |
Source: Public Records
Map
Nearby Homes
- 2020 Gardenbrook Dr
- 2328 Toll Mill Ct
- 5300 Deep Valley
- 2321 Toll Mill Ct
- 5317 Deep Valley
- 6508 Deerview Dr
- 1900 High Oaks Ln
- 4800 Theys Rd
- 5033 Theys Rd
- 5212 Theys Rd
- 7000 Holly Springs Rd
- 2517 High Ridge Dr
- 2721 Glassman Ln
- 7029 Spring Ridge Rd
- 106 Birkhaven Dr
- 9004 Penny Rd
- 8014 Penny Rd
- 8016 Penny Rd
- 6309 Windy Ridge Ct
- 3120 White Dove Ct
- 4005 Belmont Forest Way
- 4012 Dembridge Dr
- 4020 Dembridge Dr
- 4621 Fielding Dr
- 4004 Belmont Forest Way
- 2801 Swift Willow Cir
- 2800 Swift Willow Cir
- 3941 Colinwood Ln
- 3929 Belmont Forest Way
- 3928 Belmont Forest Way
- 3908 Hidden Tree Ct
- 4004 Dembridge Dr
- 2804 Swift Willow Cir
- 2805 Swift Willow Cir
- 4704 Fielding Dr
- 4000 Brittabby Ct
- 3909 Hidden Tree Ct
- 4721 Fielding Dr
- 3929 Colinwood Ln
- 4004 Brittabby Ct