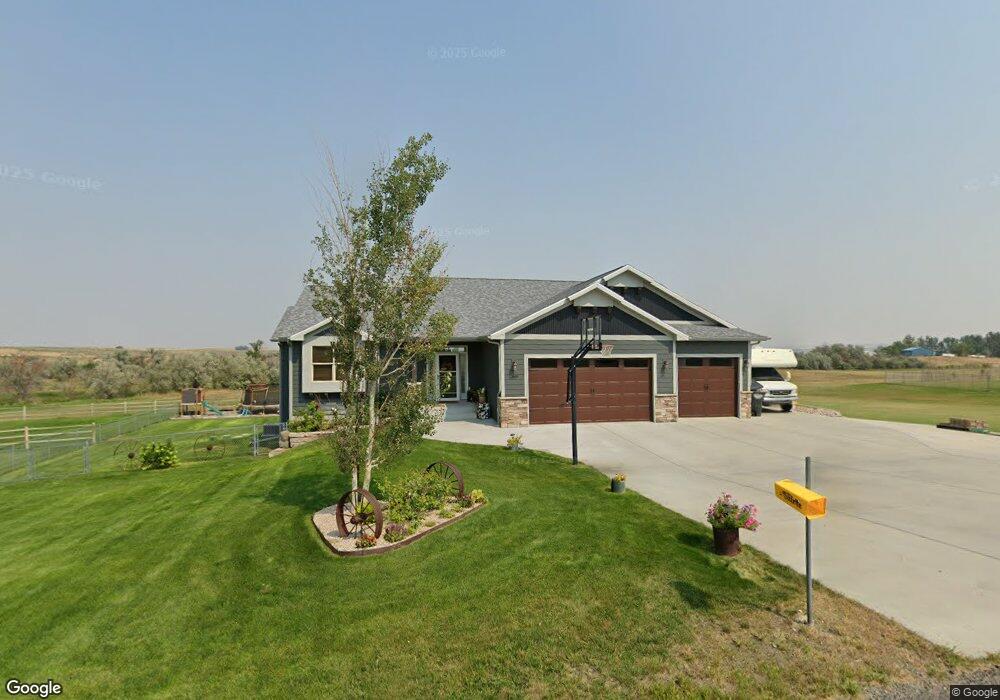
4009 Clint Rd Billings, MT 59105
Billings Heights NeighborhoodEstimated Value: $561,000 - $725,000
4
Beds
3
Baths
2,964
Sq Ft
$205/Sq Ft
Est. Value
About This Home
This home is located at 4009 Clint Rd, Billings, MT 59105 and is currently estimated at $609,041, approximately $205 per square foot. 4009 Clint Rd is a home with nearby schools including Independent Elementary School, Castle Rock Junior High School, and Skyview High School.
Ownership History
Date
Name
Owned For
Owner Type
Purchase Details
Closed on
Mar 27, 2013
Sold by
Bts Inc
Bought by
Mitchell David and Mitchell Heidi Lila June
Current Estimated Value
Home Financials for this Owner
Home Financials are based on the most recent Mortgage that was taken out on this home.
Original Mortgage
$343,292
Outstanding Balance
$242,537
Interest Rate
3.49%
Mortgage Type
New Conventional
Estimated Equity
$366,504
Purchase Details
Closed on
Nov 5, 2012
Sold by
Mitchell David E and Mitchell Heidi L
Bought by
Bts Inc and Classic Design Homes
Home Financials for this Owner
Home Financials are based on the most recent Mortgage that was taken out on this home.
Original Mortgage
$34,617
Interest Rate
3.43%
Mortgage Type
Future Advance Clause Open End Mortgage
Purchase Details
Closed on
Jul 24, 2012
Sold by
Seven Mile Creek Properties Llc
Bought by
Mitchell David E and Mitchell Heidi L
Home Financials for this Owner
Home Financials are based on the most recent Mortgage that was taken out on this home.
Original Mortgage
$33,200
Interest Rate
3.37%
Mortgage Type
Assumption
Create a Home Valuation Report for This Property
The Home Valuation Report is an in-depth analysis detailing your home's value as well as a comparison with similar homes in the area
Home Values in the Area
Average Home Value in this Area
Purchase History
| Date | Buyer | Sale Price | Title Company |
|---|---|---|---|
| Mitchell David | -- | Chicago Title | |
| Bts Inc | -- | None Available | |
| Mitchell David E | -- | None Available |
Source: Public Records
Mortgage History
| Date | Status | Borrower | Loan Amount |
|---|---|---|---|
| Open | Mitchell David | $343,292 | |
| Previous Owner | Bts Inc | $34,617 | |
| Previous Owner | Mitchell David E | $33,200 |
Source: Public Records
Tax History
| Year | Tax Paid | Tax Assessment Tax Assessment Total Assessment is a certain percentage of the fair market value that is determined by local assessors to be the total taxable value of land and additions on the property. | Land | Improvement |
|---|---|---|---|---|
| 2025 | $3,551 | $576,300 | $102,972 | $473,328 |
| 2024 | $3,551 | $516,900 | $88,976 | $427,924 |
| 2023 | $3,722 | $536,900 | $88,976 | $447,924 |
| 2022 | $2,567 | $355,400 | $0 | $0 |
| 2021 | $2,897 | $355,400 | $0 | $0 |
| 2020 | $3,032 | $358,600 | $0 | $0 |
| 2019 | $3,073 | $358,600 | $0 | $0 |
| 2018 | $3,202 | $345,700 | $0 | $0 |
| 2017 | $3,194 | $345,700 | $0 | $0 |
| 2016 | $2,847 | $326,500 | $0 | $0 |
| 2015 | $2,668 | $326,500 | $0 | $0 |
| 2014 | $2,515 | $158,841 | $0 | $0 |
Source: Public Records
Map
Nearby Homes
- 1395 W Eugene Ave
- 2647 Palmer Ln
- 2635 Palmer Ln
- 2623 Palmer Ln
- 2624 Palmer Ln
- 2617 Palmer Ln
- 1384 W Eugene Ave
- 1385 W Eugene Ave
- 2618 Palmer Ln
- 2629 Palmer Ln
- 2648 Palmer Ln
- 2641 Palmer Ln
- 1365 W Eugene Ave
- 2611 Palmer Ln
- 1394 W Eugene Ave
- 1626 Polo Ln
- 1701 Polo Ln
- 2529 Kaley Ln
- 2571 Kaley Ln
- 2577 Kaley Ln
Your Personal Tour Guide
Ask me questions while you tour the home.