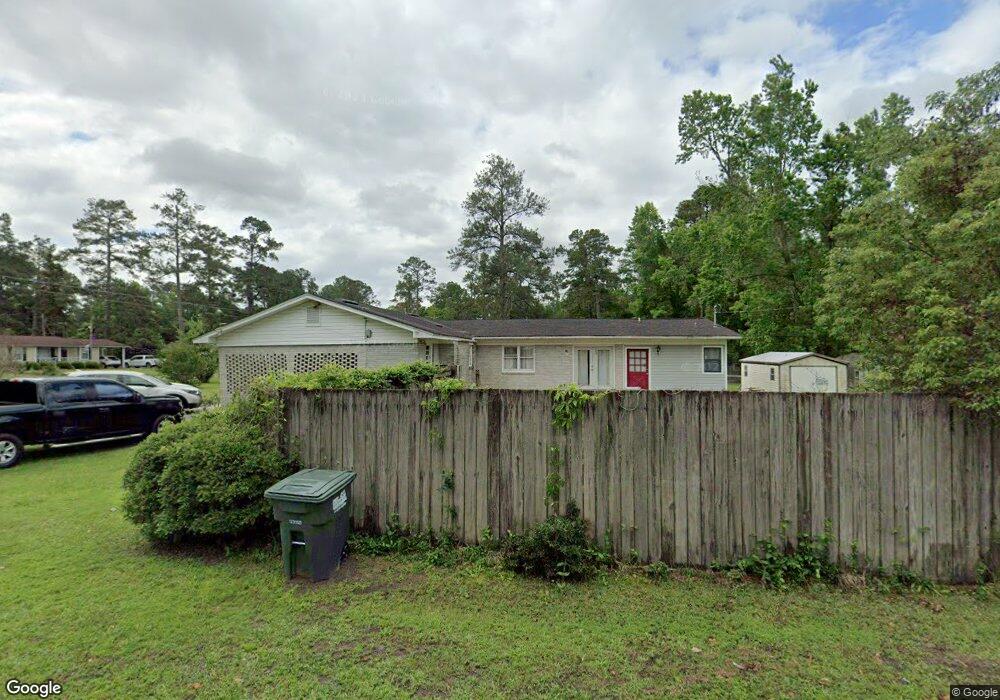
401 E Lake Dr Quitman, GA 31643
Estimated Value: $163,000 - $185,800
5
Beds
3
Baths
2,478
Sq Ft
$70/Sq Ft
Est. Value
About This Home
This home is located at 401 E Lake Dr, Quitman, GA 31643 and is currently estimated at $173,450, approximately $69 per square foot. 401 E Lake Dr is a home located in Brooks County with nearby schools including Quitman Elementary School and First Baptist Church Preschool & Kindergarten.
Ownership History
Date
Name
Owned For
Owner Type
Purchase Details
Closed on
Aug 1, 2024
Sold by
Murphy Jim A
Bought by
Brown Esther T and Brown Prince H
Current Estimated Value
Home Financials for this Owner
Home Financials are based on the most recent Mortgage that was taken out on this home.
Original Mortgage
$112,000
Outstanding Balance
$110,752
Interest Rate
6.95%
Mortgage Type
New Conventional
Estimated Equity
$62,698
Purchase Details
Closed on
Oct 12, 2010
Sold by
Federal Home Loan Mortgage Corporation
Bought by
Murphy Jim A and Murphy Patricia A
Purchase Details
Closed on
May 10, 2010
Sold by
Wells Fargo Bank Na
Bought by
Federal Home Loan Mortgage Corporation
Purchase Details
Closed on
Sep 18, 2003
Sold by
Portz Peter C and Portz Elsie B
Bought by
Snow Kimberly and Snow Vince
Purchase Details
Closed on
Feb 18, 1994
Sold by
Griner Virgil B
Bought by
Portz Peter C and Portz Elsie B
Purchase Details
Closed on
Mar 20, 1987
Sold by
Hannay Edward Stephen and Hannay Jan W
Bought by
Portz Peter C and Portz Elsie B
Create a Home Valuation Report for This Property
The Home Valuation Report is an in-depth analysis detailing your home's value as well as a comparison with similar homes in the area
Home Values in the Area
Average Home Value in this Area
Purchase History
| Date | Buyer | Sale Price | Title Company |
|---|---|---|---|
| Brown Esther T | $140,000 | -- | |
| Murphy Jim A | $88,900 | -- | |
| Federal Home Loan Mortgage Corporation | -- | -- | |
| Snow Kimberly | $118,500 | -- | |
| Portz Peter C | -- | -- | |
| Portz Peter C | $66,000 | -- |
Source: Public Records
Mortgage History
| Date | Status | Borrower | Loan Amount |
|---|---|---|---|
| Open | Brown Esther T | $112,000 |
Source: Public Records
Tax History Compared to Growth
Tax History
| Year | Tax Paid | Tax Assessment Tax Assessment Total Assessment is a certain percentage of the fair market value that is determined by local assessors to be the total taxable value of land and additions on the property. | Land | Improvement |
|---|---|---|---|---|
| 2024 | $1,978 | $62,108 | $9,360 | $52,748 |
| 2023 | $2,049 | $59,588 | $9,360 | $50,228 |
| 2022 | $1,692 | $49,508 | $9,160 | $40,348 |
| 2021 | $1,509 | $43,868 | $9,160 | $34,708 |
| 2020 | $1,547 | $43,868 | $9,160 | $34,708 |
| 2019 | $1,231 | $42,428 | $8,880 | $33,548 |
| 2018 | $1,543 | $42,428 | $8,880 | $33,548 |
| 2017 | $1,241 | $42,188 | $10,560 | $31,628 |
| 2016 | $1,229 | $42,188 | $10,560 | $31,628 |
| 2015 | -- | $42,068 | $10,560 | $31,508 |
| 2014 | -- | $43,188 | $10,560 | $32,628 |
| 2013 | -- | $43,188 | $10,560 | $32,628 |
Source: Public Records
Map
Nearby Homes
- 309 Eastlake Dr
- 804 Westlake Dr
- 1103 W Railroad St
- 2434 Dunn Rd
- 802 W Lafayette St
- 602 N Webster St
- 1540 Dunn Rd
- 5616 Empress Rd
- 606 N Court St
- 503 N Culpepper St
- 304 W Rountree St
- 621 N Court St
- 000 E Gordon St
- 1002 N Madison St
- 1306 E Screven St
- 84 W Us
- 714 Morris Ave
- 302 Waterside Dr
- 7747 Empress Rd
- 5036 Hamlin Rd