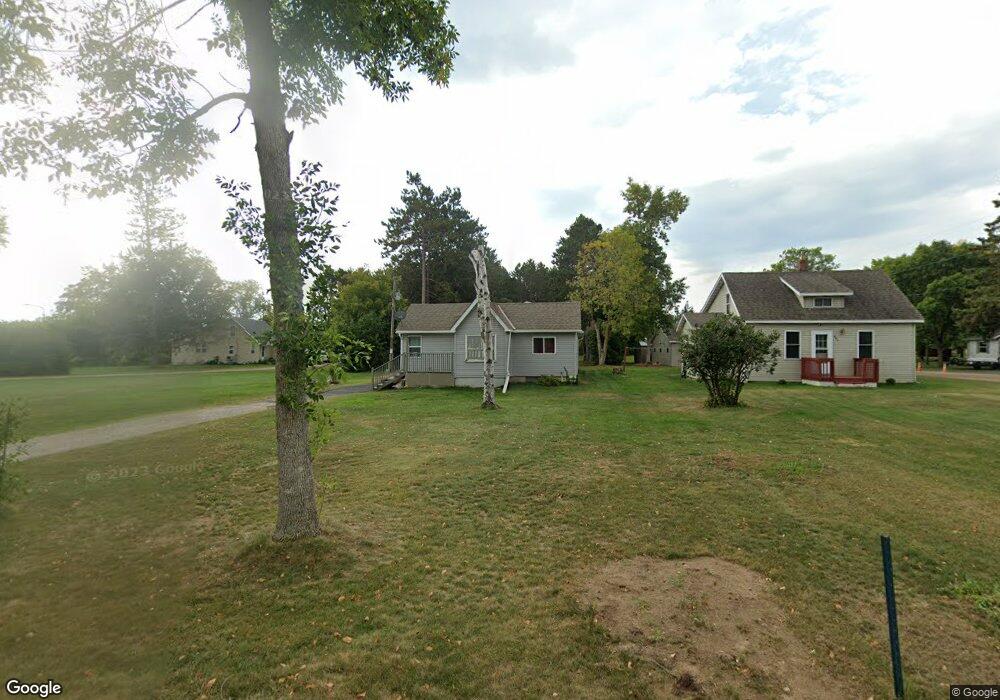
401 Lindquist St W Onamia, MN 56359
Estimated Value: $142,000 - $261,000
2
Beds
2
Baths
1,221
Sq Ft
$151/Sq Ft
Est. Value
About This Home
This home is located at 401 Lindquist St W, Onamia, MN 56359 and is currently estimated at $184,030, approximately $150 per square foot. 401 Lindquist St W is a home located in Mille Lacs County with nearby schools including Onamia Secondary School.
Ownership History
Date
Name
Owned For
Owner Type
Purchase Details
Closed on
Feb 2, 2012
Sold by
Cafferty Linda K
Bought by
Bakken Jerome Sidney
Current Estimated Value
Purchase Details
Closed on
Feb 25, 2011
Sold by
Bakken Jerome and Bakken Jerry
Bought by
Bakken Jerome and Cafferty Linda K
Home Financials for this Owner
Home Financials are based on the most recent Mortgage that was taken out on this home.
Original Mortgage
$27,900
Interest Rate
4.85%
Mortgage Type
New Conventional
Purchase Details
Closed on
Feb 17, 2011
Sold by
Federal National Mortgage Association
Bought by
Bakken Jerry
Home Financials for this Owner
Home Financials are based on the most recent Mortgage that was taken out on this home.
Original Mortgage
$27,900
Interest Rate
4.85%
Mortgage Type
New Conventional
Purchase Details
Closed on
Nov 17, 2005
Sold by
Levin Marty L and Levin Stephanie A
Bought by
Mortgage Electronic Registration Systems
Create a Home Valuation Report for This Property
The Home Valuation Report is an in-depth analysis detailing your home's value as well as a comparison with similar homes in the area
Purchase History
| Date | Buyer | Sale Price | Title Company |
|---|---|---|---|
| Bakken Jerome Sidney | -- | None Available | |
| Bakken Jerome | -- | All American Title Co Inc | |
| Bakken Jerry | -- | First Financial Title Agency | |
| Mortgage Electronic Registration Systems | $31,990 | None Available |
Source: Public Records
Mortgage History
| Date | Status | Borrower | Loan Amount |
|---|---|---|---|
| Previous Owner | Bakken Jerome | $27,900 |
Source: Public Records
Tax History
| Year | Tax Paid | Tax Assessment Tax Assessment Total Assessment is a certain percentage of the fair market value that is determined by local assessors to be the total taxable value of land and additions on the property. | Land | Improvement |
|---|---|---|---|---|
| 2025 | $1,568 | $104,800 | $20,600 | $84,200 |
| 2024 | $1,708 | $130,400 | $20,100 | $110,300 |
| 2023 | $1,382 | $136,200 | $20,100 | $116,100 |
| 2022 | $1,236 | $111,000 | $16,500 | $94,500 |
| 2021 | $1,104 | $93,700 | $16,500 | $77,200 |
| 2020 | $906 | $87,100 | $11,500 | $75,600 |
| 2019 | $892 | $72,200 | $11,300 | $60,900 |
| 2018 | $778 | $73,000 | $11,300 | $61,700 |
| 2017 | $680 | $64,700 | $10,800 | $53,900 |
| 2016 | $754 | $0 | $0 | $0 |
| 2015 | $736 | $0 | $0 | $0 |
| 2014 | $736 | $0 | $0 | $0 |
Source: Public Records
Map
Nearby Homes
- 491 Roosevelt Rd
- 200 Railroad Ave W
- 611 Kathio St
- 102 Birch St S
- XXX State Hwy 169
- 12083 350th St
- 34321 Us Highway 169
- 35455 100th Ave
- 35xxx 100th Ave
- XXX Highway 169
- TBD-1 330th St
- TBD-2 330th St
- Tbd Tamarac Rd
- XXX 330th St
- TBD Tamarac Rd
- XXX Stevens Rd
- 9736 State Highway 27
- TBD Summit Rd
- TBD 360th St
- 13001 Twilight Rd
- 403 Lindquist St W
- 501 Lindquist St W
- 501 501 Lindquist-Street-
- 403 Roosevelt Rd S
- 403 403 Roosevelt St
- 403 Cedar St S
- 503 Lindquist St W
- 310 Roosevelt Rd S
- 400 Roosevelt Rd S
- 402 Pine St S
- 404 S Pine St
- 402 402 Pine-Street-s
- 304 Lindquist St
- 308 Roosevelt Rd S
- 316 Pine St S
- 310 Cedar St S
- 310 Cedar St S
- 321 Oak St S
- 35xxx Highway #169
- 401 Pine St S
Your Personal Tour Guide
Ask me questions while you tour the home.