401 Monet Ct Unit 401 Folsom, CA 95630
The Parkway NeighborhoodEstimated Value: $401,000 - $503,000
2
Beds
2
Baths
1,313
Sq Ft
$355/Sq Ft
Est. Value
About This Home
This home is located at 401 Monet Ct Unit 401, Folsom, CA 95630 and is currently estimated at $465,709, approximately $354 per square foot. 401 Monet Ct Unit 401 is a home located in Sacramento County with nearby schools including Folsom Hills Elementary School, Folsom Middle School, and Vista Del Lago High School.
Ownership History
Date
Name
Owned For
Owner Type
Purchase Details
Closed on
Jun 29, 2011
Sold by
Barua Antara
Bought by
Barua Meetesh
Current Estimated Value
Home Financials for this Owner
Home Financials are based on the most recent Mortgage that was taken out on this home.
Original Mortgage
$139,300
Outstanding Balance
$95,669
Interest Rate
4.55%
Mortgage Type
New Conventional
Estimated Equity
$370,040
Purchase Details
Closed on
Jun 17, 2011
Sold by
Standard Pacific Corp
Bought by
Barua Meetesh
Home Financials for this Owner
Home Financials are based on the most recent Mortgage that was taken out on this home.
Original Mortgage
$139,300
Outstanding Balance
$95,669
Interest Rate
4.55%
Mortgage Type
New Conventional
Estimated Equity
$370,040
Purchase Details
Closed on
Feb 24, 2010
Sold by
Grant Taylor B
Bought by
Standard Pacific Corp
Create a Home Valuation Report for This Property
The Home Valuation Report is an in-depth analysis detailing your home's value as well as a comparison with similar homes in the area
Home Values in the Area
Average Home Value in this Area
Purchase History
| Date | Buyer | Sale Price | Title Company |
|---|---|---|---|
| Barua Meetesh | -- | First American Title Company | |
| Barua Meetesh | $199,000 | First American Title Company | |
| Standard Pacific Corp | $2,117,254 | None Available |
Source: Public Records
Mortgage History
| Date | Status | Borrower | Loan Amount |
|---|---|---|---|
| Open | Barua Meetesh | $139,300 |
Source: Public Records
Tax History Compared to Growth
Tax History
| Year | Tax Paid | Tax Assessment Tax Assessment Total Assessment is a certain percentage of the fair market value that is determined by local assessors to be the total taxable value of land and additions on the property. | Land | Improvement |
|---|---|---|---|---|
| 2025 | $3,126 | $254,941 | $76,865 | $178,076 |
| 2024 | $3,126 | $249,943 | $75,358 | $174,585 |
| 2023 | $3,079 | $245,043 | $73,881 | $171,162 |
| 2022 | $3,039 | $240,239 | $72,433 | $167,806 |
| 2021 | $3,002 | $235,529 | $71,013 | $164,516 |
| 2020 | $2,974 | $233,115 | $70,285 | $162,830 |
| 2019 | $2,932 | $228,545 | $68,907 | $159,638 |
| 2018 | $2,874 | $224,064 | $67,556 | $156,508 |
| 2017 | $2,709 | $219,672 | $66,232 | $153,440 |
| 2016 | $2,867 | $215,366 | $64,934 | $150,432 |
| 2015 | $2,779 | $212,132 | $63,959 | $148,173 |
| 2014 | $2,662 | $207,978 | $62,707 | $145,271 |
Source: Public Records
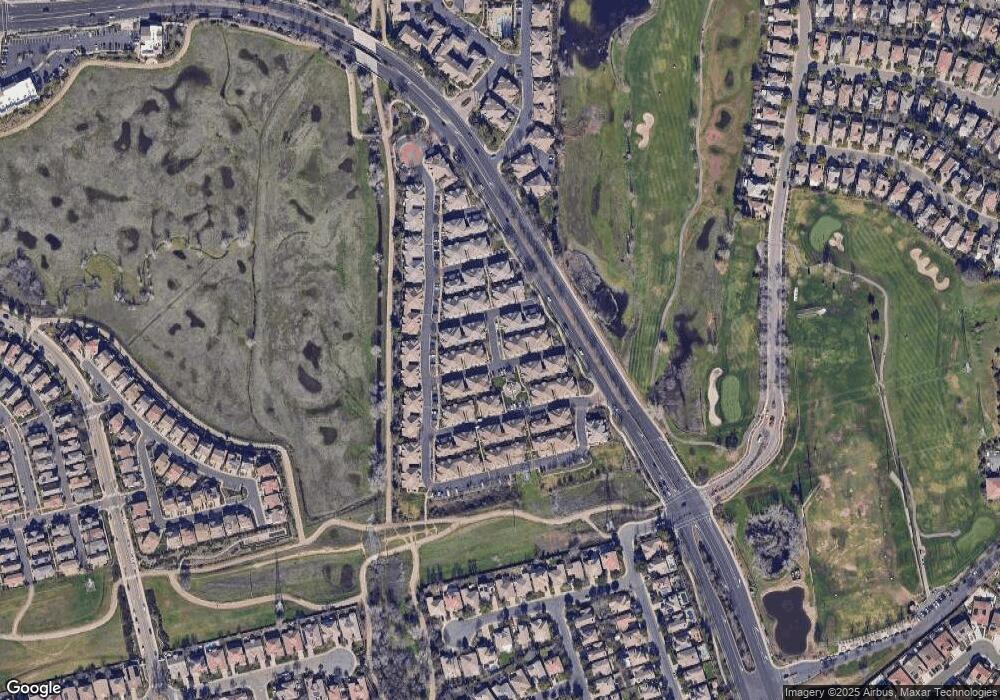
Map
Nearby Homes
- 206 Rivage Cir
- 502 Monet Ln Unit 502
- 705 Esplanade Cir
- 1376 Folsom Meadows Cir N
- 1381 Haddington Dr
- 1752 Parkway Dr N
- 1557 Borrasca Dr
- 1416 Haddington Dr
- 1604 Thurman Way
- 1579 Bonanza Ln
- 1740 Langholm Way
- 1903 Esplanade Cir
- 1553 Bonanza Ln
- 1599 Ballou Cir
- 1195 Fergusen Way
- 1173 Fergusen Way
- 1480 Bicker Cir
- 1729 Dornie Cir
- 1522 Thurman Way
- 1319 Vineyard Ct
- 205 Cezanne Ln Unit 205
- 204 Cezanne Ln
- 205 Monet Way Unit 205
- 301 Cezanne Ct
- 103 Cezanne Way
- 102 Cezanne Way Unit 102
- 101 Cezanne Way
- 205 Cezanne Way Unit 205
- 204 Cezanne Way Unit 204
- 203 Cezanne Way Unit 203
- 202 Cezanne Way Unit 202
- 201 Cezanne Way
- 404 Cezanne Ct Unit 404
- 402 Cezanne Ct Unit 402
- 302 Matisse Ct
- 105 Matisse Ct
- 206 Cezanne Way Unit 206
- 106 Cezanne Way
- 105 Cezanne Ln Unit 105
- 105 Cezanne Way Unit 105