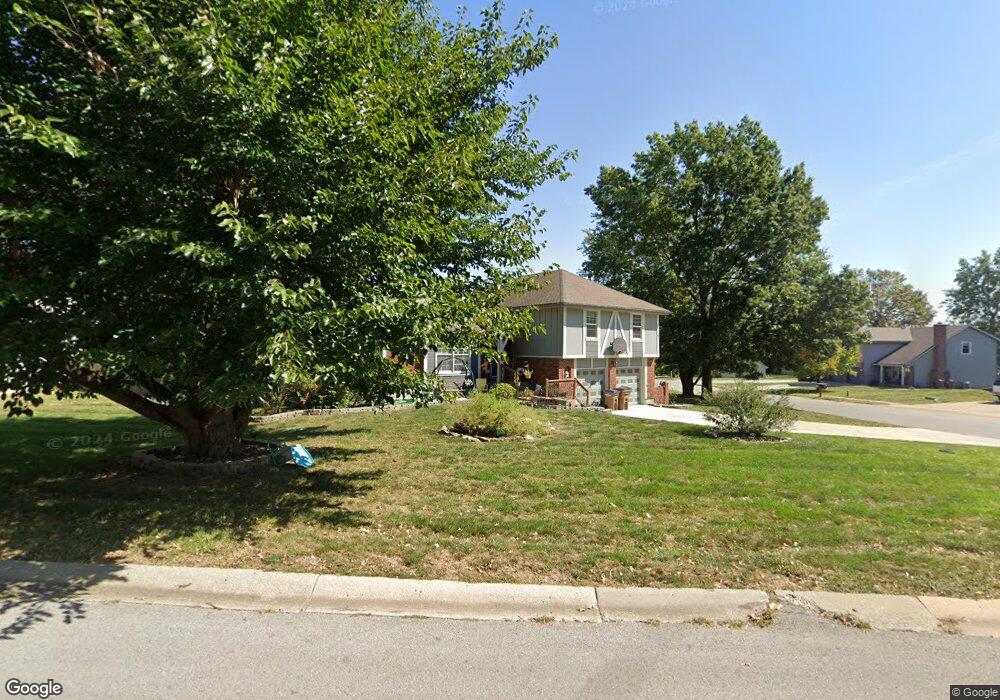
401 N Jefferson St Raymore, MO 64083
Estimated Value: $320,347 - $332,000
3
Beds
2
Baths
1,706
Sq Ft
$191/Sq Ft
Est. Value
About This Home
This home is located at 401 N Jefferson St, Raymore, MO 64083 and is currently estimated at $325,337, approximately $190 per square foot. 401 N Jefferson St is a home located in Cass County with nearby schools including Timber Creek Elementary School, Raymore-Peculiar East Middle School, and Raymore-Peculiar Senior High School.
Ownership History
Date
Name
Owned For
Owner Type
Purchase Details
Closed on
Mar 3, 2025
Sold by
Shelley Milton J and Sprofera Lynette M
Bought by
Milton J Shelley Intervivos Trust and Shelley
Current Estimated Value
Purchase Details
Closed on
Sep 11, 2015
Sold by
Shelley Milton J and Shelley Barbara
Bought by
Shelley Milton J
Home Financials for this Owner
Home Financials are based on the most recent Mortgage that was taken out on this home.
Original Mortgage
$123,800
Interest Rate
3.92%
Mortgage Type
VA
Purchase Details
Closed on
Sep 20, 2005
Sold by
Shelley Milton J
Bought by
Shelley Milton J and Shelley Barbara
Home Financials for this Owner
Home Financials are based on the most recent Mortgage that was taken out on this home.
Original Mortgage
$101,500
Interest Rate
5.88%
Mortgage Type
New Conventional
Create a Home Valuation Report for This Property
The Home Valuation Report is an in-depth analysis detailing your home's value as well as a comparison with similar homes in the area
Home Values in the Area
Average Home Value in this Area
Purchase History
| Date | Buyer | Sale Price | Title Company |
|---|---|---|---|
| Milton J Shelley Intervivos Trust | -- | None Listed On Document | |
| Shelley Milton J | -- | None Available | |
| Shelley Milton J | -- | -- |
Source: Public Records
Mortgage History
| Date | Status | Borrower | Loan Amount |
|---|---|---|---|
| Previous Owner | Shelley Milton J | $123,800 | |
| Previous Owner | Shelley Milton J | $101,500 |
Source: Public Records
Tax History Compared to Growth
Tax History
| Year | Tax Paid | Tax Assessment Tax Assessment Total Assessment is a certain percentage of the fair market value that is determined by local assessors to be the total taxable value of land and additions on the property. | Land | Improvement |
|---|---|---|---|---|
| 2025 | $3,041 | $42,290 | $5,310 | $36,980 |
| 2024 | $3,041 | $37,370 | $4,820 | $32,550 |
| 2023 | $3,037 | $37,370 | $4,820 | $32,550 |
| 2022 | $2,732 | $33,390 | $4,820 | $28,570 |
| 2021 | $2,732 | $33,390 | $4,820 | $28,570 |
| 2020 | $2,596 | $31,170 | $4,820 | $26,350 |
| 2019 | $2,507 | $31,170 | $4,820 | $26,350 |
| 2018 | $2,337 | $28,060 | $4,150 | $23,910 |
| 2017 | $2,103 | $28,060 | $4,150 | $23,910 |
| 2016 | $2,103 | $26,210 | $4,150 | $22,060 |
| 2015 | $2,104 | $26,210 | $4,150 | $22,060 |
| 2014 | $2,105 | $26,210 | $4,150 | $22,060 |
| 2013 | -- | $26,210 | $4,150 | $22,060 |
Source: Public Records
Map
Nearby Homes
- 408 N Washington St
- 101 N Franklin St
- 100 N Franklin St
- 109 E Heritage Dr
- 410 Appaloosa Dr
- 221 N Pointe Ln
- 308 N Woodson Dr
- 124 E Calico Dr
- 222 N Madison St
- 204 N Pointe Ln
- 227 N Woodson Dr
- 112 W Grant Dr
- 615 N Conway St
- 504 Foxglove Ln
- 506 Foxglove Ln
- 508 Foxglove Ln
- 709 Wood Sage Ct
- 701 Red Clover Ct
- 704 Red Clover Ct
- 701 Wood Sage Ct
- 403 N Jefferson St
- 402 N Jackson St
- 404 N Jackson St
- 205 W Foxwood Dr
- 405 N Jefferson St
- 404 N Jefferson St
- 209 W Foxwood Dr
- 203 W Foxwood Dr
- 406 N Jackson St
- 201 W Foxwood Dr
- 406 N Jefferson St
- 213 W Foxwood Dr
- 407 N Jefferson St
- 401 N Madison St
- 401 N Jackson St
- 403 N Madison St
- 408 N Jackson St
- 403 N Jackson St
- 408 N Jefferson St
- 331 N Madison St