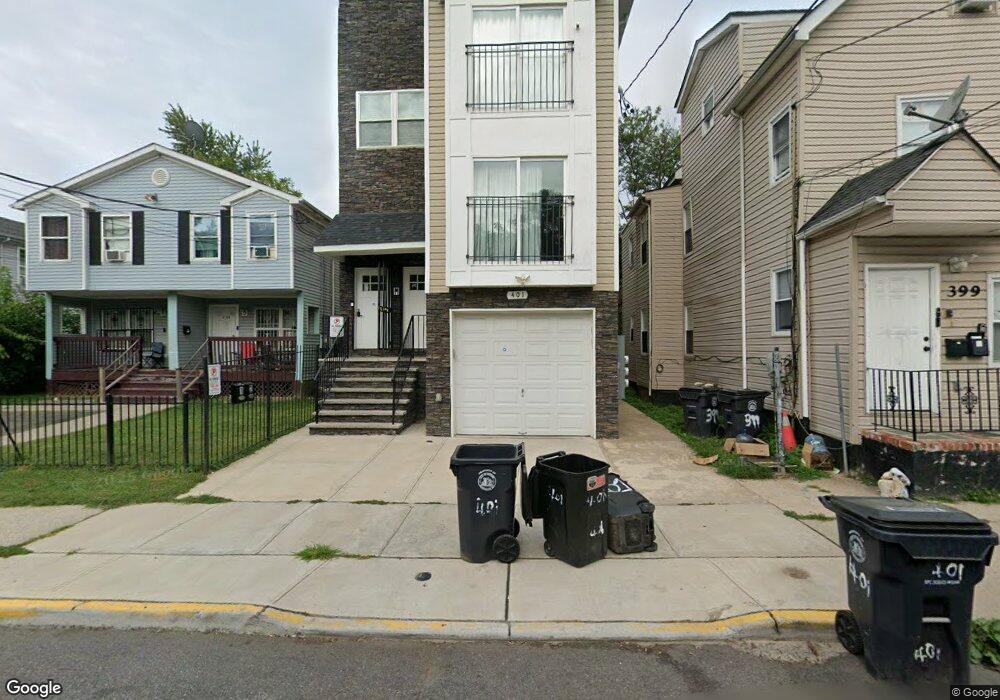
401 S 8th St Unit 2 Newark, NJ 07103
West Side NeighborhoodEstimated Value: $884,612
3
Beds
2
Baths
3,341
Sq Ft
$265/Sq Ft
Est. Value
About This Home
This home is located at 401 S 8th St Unit 2, Newark, NJ 07103 and is currently estimated at $884,612, approximately $264 per square foot. 401 S 8th St Unit 2 is a home located in Essex County with nearby schools including Harriet Tubman School, Camden Street Elementary School, and Cleveland Elementary School.
Ownership History
Date
Name
Owned For
Owner Type
Purchase Details
Closed on
Sep 29, 2022
Sold by
Borges Niceia
Bought by
Adeyemi Olufunmilayo Olayin
Current Estimated Value
Home Financials for this Owner
Home Financials are based on the most recent Mortgage that was taken out on this home.
Original Mortgage
$595,237
Outstanding Balance
$572,757
Interest Rate
6.7%
Mortgage Type
FHA
Estimated Equity
$311,855
Purchase Details
Closed on
Dec 16, 2005
Sold by
Harris Alberta
Bought by
Borges Niceia
Create a Home Valuation Report for This Property
The Home Valuation Report is an in-depth analysis detailing your home's value as well as a comparison with similar homes in the area
Home Values in the Area
Average Home Value in this Area
Purchase History
| Date | Buyer | Sale Price | Title Company |
|---|---|---|---|
| Adeyemi Olufunmilayo Olayin | $650,000 | None Listed On Document | |
| Borges Niceia | $95,000 | -- |
Source: Public Records
Mortgage History
| Date | Status | Borrower | Loan Amount |
|---|---|---|---|
| Open | Adeyemi Olufunmilayo Olayin | $595,237 |
Source: Public Records
Tax History
| Year | Tax Paid | Tax Assessment Tax Assessment Total Assessment is a certain percentage of the fair market value that is determined by local assessors to be the total taxable value of land and additions on the property. | Land | Improvement |
|---|---|---|---|---|
| 2025 | -- | $409,600 | $31,300 | $378,300 |
| 2024 | -- | $409,600 | $31,300 | $378,300 |
| 2023 | $1,169 | $409,600 | $31,300 | $378,300 |
| 2022 | $1,169 | $31,300 | $31,300 | $0 |
| 2021 | $1,169 | $31,300 | $31,300 | $0 |
| 2020 | $1,189 | $31,300 | $31,300 | $0 |
| 2019 | $1,177 | $31,300 | $31,300 | $0 |
| 2018 | $1,156 | $31,300 | $31,300 | $0 |
| 2017 | $1,114 | $31,300 | $31,300 | $0 |
| 2016 | $1,077 | $31,300 | $31,300 | $0 |
| 2015 | $1,036 | $31,300 | $31,300 | $0 |
| 2014 | $971 | $31,300 | $31,300 | $0 |
Source: Public Records
Map
Nearby Homes
Your Personal Tour Guide
Ask me questions while you tour the home.