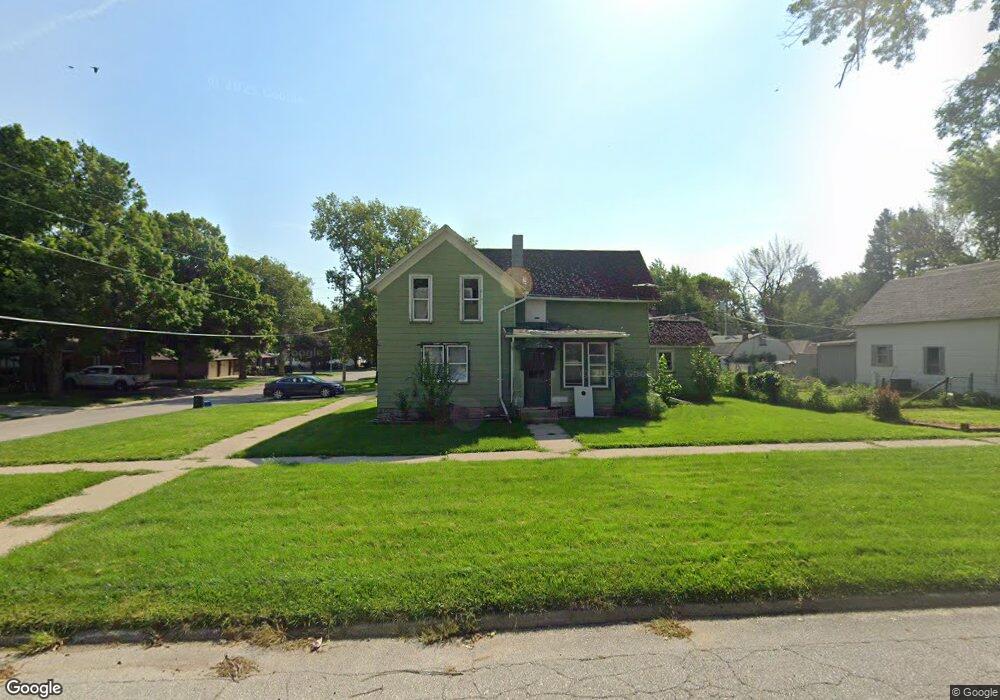
401 S Maple St Odebolt, IA 51458
Estimated Value: $51,920 - $96,000
Studio
--
Bath
1,416
Sq Ft
$57/Sq Ft
Est. Value
About This Home
This home is located at 401 S Maple St, Odebolt, IA 51458 and is currently estimated at $80,230, approximately $56 per square foot. 401 S Maple St is a home located in Sac County with nearby schools including Odebolt Arthur Battle Creek Ida Grove Elementary - Odebolt, Odebolt Arthur Battle Creek Ida Grove Middle School, and Odebolt Arthur Battle Creek Ida Grove High School.
Ownership History
Date
Name
Owned For
Owner Type
Purchase Details
Closed on
Aug 5, 2022
Sold by
Blanchard James P and Blanchard Dawn M
Bought by
Loger Joshua and Loger Amber
Current Estimated Value
Purchase Details
Closed on
Sep 29, 2012
Sold by
Ortner Andrew J and Ortner Abby A
Bought by
Gehlsen Lesly G
Purchase Details
Closed on
Jun 6, 2011
Sold by
Howard Center Inc
Bought by
Gehlsen Lesly G
Purchase Details
Closed on
Mar 1, 2011
Sold by
United Bank Of Iowa
Bought by
Gehlsen Lesly G
Purchase Details
Closed on
Dec 17, 2010
Sold by
Hoefling Mike and Hoefling Gretchen
Bought by
Gehlsen Lesly G
Purchase Details
Closed on
Dec 8, 2009
Sold by
Salisbury Shelly L
Bought by
Gehlsen Lesly G
Create a Home Valuation Report for This Property
The Home Valuation Report is an in-depth analysis detailing your home's value as well as a comparison with similar homes in the area
Purchase History
| Date | Buyer | Sale Price | Title Company |
|---|---|---|---|
| Loger Joshua | -- | None Listed On Document | |
| Gehlsen Lesly G | $14,000 | None Available | |
| Gehlsen Lesly G | $9,000 | None Available | |
| Gehlsen Lesly G | $14,000 | None Available | |
| Gehlsen Lesly G | $5,000 | None Available | |
| Gehlsen Lesly G | $6,000 | None Available |
Source: Public Records
Tax History
| Year | Tax Paid | Tax Assessment Tax Assessment Total Assessment is a certain percentage of the fair market value that is determined by local assessors to be the total taxable value of land and additions on the property. | Land | Improvement |
|---|---|---|---|---|
| 2025 | $404 | $27,820 | $2,290 | $25,530 |
| 2024 | $404 | $24,360 | $2,080 | $22,280 |
| 2023 | $342 | $24,080 | $2,080 | $22,000 |
| 2022 | $330 | $17,710 | $2,080 | $15,630 |
| 2021 | $330 | $17,710 | $2,080 | $15,630 |
| 2020 | $296 | $15,420 | $2,080 | $13,340 |
| 2019 | $282 | $15,420 | $2,080 | $13,340 |
| 2018 | $262 | $15,170 | $0 | $0 |
| 2017 | $262 | $17,050 | $0 | $0 |
| 2016 | $318 | $17,050 | $0 | $0 |
| 2015 | $318 | $17,200 | $0 | $0 |
| 2014 | $310 | $17,200 | $0 | $0 |
Source: Public Records
Map
Nearby Homes
- 405 S Maple St
- 410 S Walnut St
- 409 S Maple St
- 111 W 4th St
- 404 S Main St
- 317 S Maple St
- 400 S Maple St Unit 443
- 408 S Main St
- 408 S Main St Unit 1
- 104 W 4th St
- 404 S Maple St
- 313 S Maple St
- 103 W 4th St
- 412 S Main St
- 412 S Main St
- 408 S Maple St
- 417 S Maple St
- 312 S Maple St
- 201 W 4th St
- 416 S Main St
Your Personal Tour Guide
Ask me questions while you tour the home.