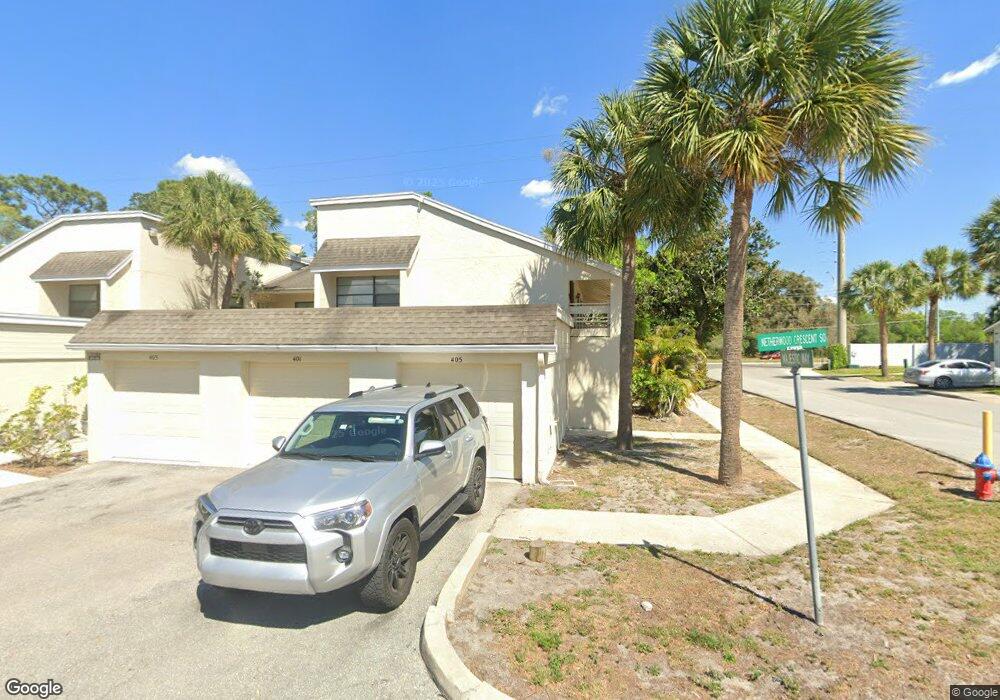
401 S Netherwood Crescent Unit 501 Altamonte Springs, FL 32714
Spring Valley NeighborhoodEstimated Value: $206,000 - $278,000
3
Beds
2
Baths
1,245
Sq Ft
$183/Sq Ft
Est. Value
About This Home
This home is located at 401 S Netherwood Crescent Unit 501, Altamonte Springs, FL 32714 and is currently estimated at $227,524, approximately $182 per square foot. 401 S Netherwood Crescent Unit 501 is a home located in Seminole County with nearby schools including Forest City Elementary School, Lyman High School, and Milwee Middle School.
Ownership History
Date
Name
Owned For
Owner Type
Purchase Details
Closed on
Mar 17, 2021
Sold by
Wise Ellen J
Bought by
Wise Ellen J and Ej Wise Trust
Current Estimated Value
Purchase Details
Closed on
Sep 26, 2005
Sold by
Goodenow Shawn
Bought by
Wise Ellen J
Home Financials for this Owner
Home Financials are based on the most recent Mortgage that was taken out on this home.
Original Mortgage
$194,000
Outstanding Balance
$103,903
Interest Rate
5.77%
Mortgage Type
Unknown
Estimated Equity
$123,621
Purchase Details
Closed on
Jan 15, 2002
Sold by
Tdm Properties Inc C
Bought by
Goodenow Shawn
Home Financials for this Owner
Home Financials are based on the most recent Mortgage that was taken out on this home.
Original Mortgage
$80,057
Interest Rate
6.99%
Mortgage Type
FHA
Purchase Details
Closed on
May 1, 1985
Bought by
Wise Ellen J
Create a Home Valuation Report for This Property
The Home Valuation Report is an in-depth analysis detailing your home's value as well as a comparison with similar homes in the area
Home Values in the Area
Average Home Value in this Area
Purchase History
| Date | Buyer | Sale Price | Title Company |
|---|---|---|---|
| Wise Ellen J | -- | Accommodation | |
| Wise Ellen J | $200,000 | Title Pros Of Florida Inc | |
| Goodenow Shawn | $81,900 | -- | |
| Wise Ellen J | $847,500 | -- |
Source: Public Records
Mortgage History
| Date | Status | Borrower | Loan Amount |
|---|---|---|---|
| Open | Wise Ellen J | $194,000 | |
| Previous Owner | Goodenow Shawn | $80,057 |
Source: Public Records
Tax History Compared to Growth
Tax History
| Year | Tax Paid | Tax Assessment Tax Assessment Total Assessment is a certain percentage of the fair market value that is determined by local assessors to be the total taxable value of land and additions on the property. | Land | Improvement |
|---|---|---|---|---|
| 2024 | $452 | $54,663 | -- | -- |
| 2023 | $424 | $53,071 | $0 | $0 |
| 2021 | $420 | $50,024 | $0 | $0 |
| 2020 | $411 | $49,333 | $0 | $0 |
| 2019 | $397 | $48,224 | $0 | $0 |
| 2018 | $386 | $47,325 | $0 | $0 |
| 2017 | $375 | $46,352 | $0 | $0 |
| 2016 | $370 | $45,717 | $0 | $0 |
| 2015 | $359 | $45,083 | $0 | $0 |
| 2014 | $359 | $44,725 | $0 | $0 |
Source: Public Records
Map
Nearby Homes
- 408 S Netherwood Crescent
- 555 Majestic Way Unit 1304
- 526 Heatherton Village Unit 526
- 510 Beechwood Ave
- 520 Via Verona Ln Unit 103
- 512 Beechwood Ave
- 522 Boxelder Ave
- 610 Heatherton Village
- 508 Cottonwood Dr
- 511 Bristol Dr
- 437 Hemlock St
- 515 Carambola Ave
- 147 Olive Tree Cir Unit 147
- 137 Olive Tree Cir
- 148 Olive Tree Cir
- 110 Frances Dr
- 196 Riverbend Dr Unit 101
- 601 Greenbriar Blvd
- 448 S Meander Dr
- 719 Little Wekiva Cir
- 403 S Netherwood Crescent Unit 502
- 409 S Netherwood Crescent Unit 504
- 405 S Netherwood Crescent Unit 506
- 407 S Netherwood Crescent
- 411 S Netherwood Crescent Unit 505
- 415 S Netherwood Crescent Unit 402
- 413 S Netherwood Crescent Unit 413
- 413 S Netherwood Crescent
- 417 S Netherwood Crescent
- 400 S Netherwood Crescent
- 402 S Netherwood Crescent
- 421 S Netherwood Crescent
- 423 S Netherwood Crescent Unit 22
- 423 S Netherwood Crescent Unit 405
- 406 S Netherwood Crescent
- 478 Majestic Way
- 476 Majestic Way
- 419 S Netherwood Crescent Unit 403
- 480 Majestic Way
- 474 Majestic Way