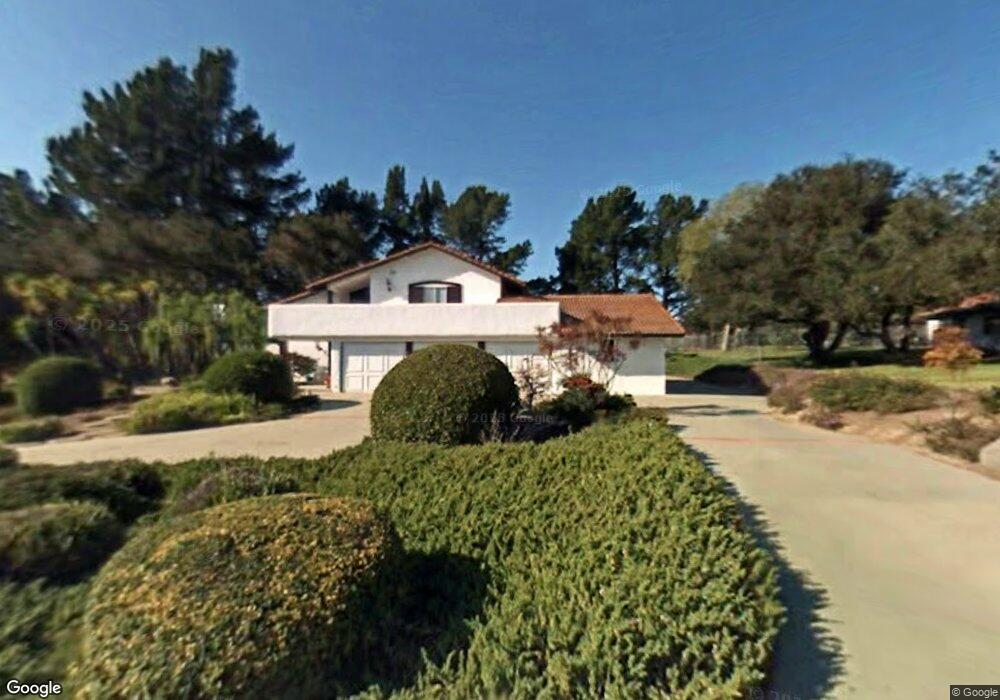
401 Saint Andrews Way Lompoc, CA 93436
Estimated Value: $917,233 - $980,000
4
Beds
3
Baths
2,983
Sq Ft
$319/Sq Ft
Est. Value
About This Home
This home is located at 401 Saint Andrews Way, Lompoc, CA 93436 and is currently estimated at $950,558, approximately $318 per square foot. 401 Saint Andrews Way is a home located in Santa Barbara County with nearby schools including Buena Vista Elementary School, Cabrillo High School, and Olive Grove Charter - Lompoc.
Ownership History
Date
Name
Owned For
Owner Type
Purchase Details
Closed on
Nov 5, 2025
Sold by
Gausman Family Trust and Gausman William H
Bought by
Gausman Grace Karen and Gausman William H
Current Estimated Value
Purchase Details
Closed on
Jan 22, 2024
Sold by
Gausman Family Trust
Bought by
Gausman Grace Karen and Gausman William H
Purchase Details
Closed on
Apr 23, 1998
Sold by
Gausman William H and Gausman Patricia J
Bought by
Gausman William H and Gausman Patricia J
Purchase Details
Closed on
Oct 26, 1995
Sold by
Gausman William H and Gausman Patricia J
Bought by
Gausman William H and Gausman Patricia J
Home Financials for this Owner
Home Financials are based on the most recent Mortgage that was taken out on this home.
Original Mortgage
$203,000
Interest Rate
7.58%
Purchase Details
Closed on
Feb 1, 1994
Sold by
Gausman William H and Gausman Patricia J
Bought by
Gausman Family Lp
Purchase Details
Closed on
Nov 2, 1993
Sold by
Gausman Family L P
Bought by
Gausman William H and Gausman Patricia J
Home Financials for this Owner
Home Financials are based on the most recent Mortgage that was taken out on this home.
Original Mortgage
$203,150
Interest Rate
4.25%
Create a Home Valuation Report for This Property
The Home Valuation Report is an in-depth analysis detailing your home's value as well as a comparison with similar homes in the area
Home Values in the Area
Average Home Value in this Area
Purchase History
| Date | Buyer | Sale Price | Title Company |
|---|---|---|---|
| Gausman Grace Karen | -- | None Listed On Document | |
| Gausman Grace Karen | -- | None Listed On Document | |
| Gausman William H | -- | -- | |
| Gausman William H | -- | Chicago Title Co | |
| Gausman Family Lp | -- | -- | |
| Gausman William H | -- | Stewart Title Of Santa Barba |
Source: Public Records
Mortgage History
| Date | Status | Borrower | Loan Amount |
|---|---|---|---|
| Previous Owner | Gausman William H | $203,000 | |
| Previous Owner | Gausman William H | $203,150 |
Source: Public Records
Tax History
| Year | Tax Paid | Tax Assessment Tax Assessment Total Assessment is a certain percentage of the fair market value that is determined by local assessors to be the total taxable value of land and additions on the property. | Land | Improvement |
|---|---|---|---|---|
| 2025 | $2,195 | $176,457 | $34,388 | $142,069 |
| 2023 | $2,195 | $169,606 | $33,053 | $136,553 |
| 2022 | $2,161 | $166,281 | $32,405 | $133,876 |
| 2021 | $2,180 | $163,021 | $31,770 | $131,251 |
| 2020 | $2,160 | $161,351 | $31,445 | $129,906 |
| 2019 | $2,129 | $158,188 | $30,829 | $127,359 |
| 2018 | $2,101 | $155,087 | $30,225 | $124,862 |
| 2017 | $1,977 | $152,047 | $29,633 | $122,414 |
| 2016 | $1,674 | $149,066 | $29,052 | $120,014 |
| 2015 | $1,661 | $146,828 | $28,616 | $118,212 |
| 2014 | -- | $143,953 | $28,056 | $115,897 |
Source: Public Records
Map
Nearby Homes
- 372 Falcon Crest Dr
- 4173 Oakwood Ct
- 250 Saint Andrews Way
- 649 Burning Tree Way
- 372 Oak Hill Dr
- 0 Oak Hill Dr Unit 24-783
- 73 Stanford Cir
- 6 Stanford Cir
- 240 Oak Hill Dr
- 113 Gemini Ave
- 232 Vega Ave
- 1445 Calle Marana
- 3660 Rucker Rd
- 3939 Mesa Circle Dr
- 3922 Mesa Circle Dr
- 3916 Mesa Circle Dr Unit A
- 3725 Jupiter Ave
- 3578 Via Lato
- 972 Pellham Dr
- 832 Onstott Rd
- 391 St Andrews Way
- 417 Saint Andrews Way
- 417 St Andrews Way
- 410 Saint Andrews Way
- 394 Saint Andrews Way
- 410 St Andrews Way
- 379 St Andrews Way
- 379 Saint Andrews Way
- 437 Saint Andrews Way
- 420 Saint Andrews Way
- 384 Saint Andrews Way
- 384 St Andrews Way
- 432 Saint Andrews Way
- 376 Saint Andrews Way
- 367 Saint Andrews Way
- 3980 Pinehurst Dr
- 461 Saint Andrews Way
- 461 St Andrews Way
- 3989 Pinehurst Dr
Your Personal Tour Guide
Ask me questions while you tour the home.