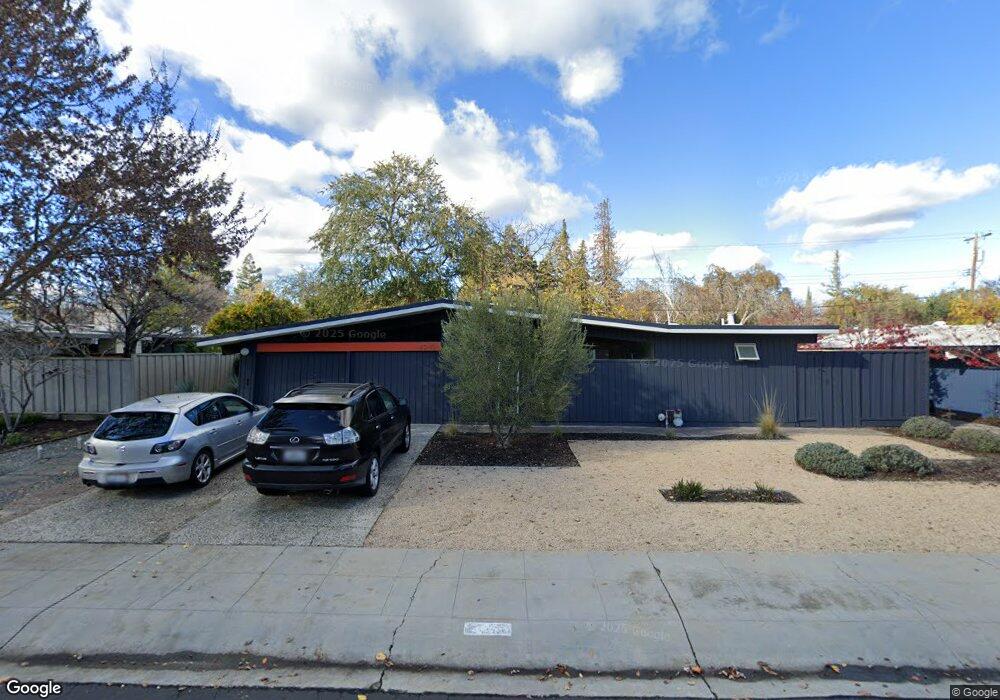
4010 Ben Lomond Dr Palo Alto, CA 94306
Greenmeadow NeighborhoodEstimated Value: $3,548,738 - $3,803,000
4
Beds
3
Baths
1,960
Sq Ft
$1,873/Sq Ft
Est. Value
About This Home
This home is located at 4010 Ben Lomond Dr, Palo Alto, CA 94306 and is currently estimated at $3,671,435, approximately $1,873 per square foot. 4010 Ben Lomond Dr is a home located in Santa Clara County with nearby schools including Fairmeadow Elementary School, Jane Lathrop Stanford Middle School, and Henry M. Gunn High School.
Ownership History
Date
Name
Owned For
Owner Type
Purchase Details
Closed on
May 18, 2011
Sold by
Bhat Jerome C and Tan Siu L
Bought by
Bhat Jerome C and Tan Siu L
Current Estimated Value
Home Financials for this Owner
Home Financials are based on the most recent Mortgage that was taken out on this home.
Original Mortgage
$729,750
Outstanding Balance
$464,105
Interest Rate
3.12%
Mortgage Type
New Conventional
Estimated Equity
$3,207,330
Purchase Details
Closed on
Dec 20, 2010
Sold by
Bhat Jerome C and Tan Siu Ling Audra
Bought by
Bhat Jerome C and Tan Siu L
Purchase Details
Closed on
Feb 22, 2010
Sold by
Pollak Richard
Bought by
Bhat Jerome C and Tan Siu Ling Audra
Home Financials for this Owner
Home Financials are based on the most recent Mortgage that was taken out on this home.
Original Mortgage
$215,200
Interest Rate
4.93%
Mortgage Type
Future Advance Clause Open End Mortgage
Create a Home Valuation Report for This Property
The Home Valuation Report is an in-depth analysis detailing your home's value as well as a comparison with similar homes in the area
Home Values in the Area
Average Home Value in this Area
Purchase History
| Date | Buyer | Sale Price | Title Company |
|---|---|---|---|
| Bhat Jerome C | -- | Old Republic Title | |
| Bhat Jerome C | -- | Old Republic Title | |
| Bhat Jerome C | -- | None Available | |
| Bhat Jerome C | -- | Old Republic Title Company |
Source: Public Records
Mortgage History
| Date | Status | Borrower | Loan Amount |
|---|---|---|---|
| Open | Bhat Jerome C | $729,750 | |
| Closed | Bhat Jerome C | $215,200 | |
| Closed | Bhat Jerome C | $729,750 |
Source: Public Records
Tax History Compared to Growth
Tax History
| Year | Tax Paid | Tax Assessment Tax Assessment Total Assessment is a certain percentage of the fair market value that is determined by local assessors to be the total taxable value of land and additions on the property. | Land | Improvement |
|---|---|---|---|---|
| 2025 | $20,873 | $1,724,572 | $1,394,083 | $330,489 |
| 2024 | $20,873 | $1,690,758 | $1,366,749 | $324,009 |
| 2023 | $20,565 | $1,657,606 | $1,339,950 | $317,656 |
| 2022 | $20,324 | $1,625,105 | $1,313,677 | $311,428 |
| 2021 | $19,924 | $1,593,241 | $1,287,919 | $305,322 |
| 2020 | $19,519 | $1,576,905 | $1,274,713 | $302,192 |
| 2019 | $19,302 | $1,545,986 | $1,249,719 | $296,267 |
| 2018 | $18,779 | $1,515,673 | $1,225,215 | $290,458 |
| 2017 | $18,449 | $1,485,955 | $1,201,192 | $284,763 |
| 2016 | $17,964 | $1,456,820 | $1,177,640 | $279,180 |
| 2015 | $17,622 | $1,420,938 | $1,159,951 | $260,987 |
| 2014 | $17,233 | $1,393,105 | $1,137,230 | $255,875 |
Source: Public Records
Map
Nearby Homes
- 278 Monroe Dr Unit 17
- 4225 Park Blvd
- 181 Del Medio Ave Unit 307
- 4148 Byron St
- 342 Carolina Ln
- 4206 Rickeys Way Unit C
- 432 Victory Ave
- 2483 Whitney Dr
- 4173 El Camino Real Unit 1
- 3946 Louis Rd
- 103 Whits Rd
- 2474 Alvin St
- 4250 El Camino Real Unit B120
- 2524 W Middlefield Rd Unit 2
- 49 Showers Dr Unit J317
- 49 Showers Dr Unit D460
- 49 Showers Dr Unit E151
- 4115 El Camino Real Unit 333
- 4115 El Camino Real Unit 331
- 4115 El Camino Real Unit 222
- 4006 Ben Lomond Dr
- 4014 Ben Lomond Dr
- 270 Parkside Dr
- 260 Parkside Dr
- 280 Parkside Dr
- 4009 Ben Lomond Dr
- 4018 Ben Lomond Dr
- 4012 Scripps Ave
- 250 Parkside Dr
- 4005 Ben Lomond Dr
- 4013 Ben Lomond Dr
- 290 Parkside Dr
- 240 Parkside Dr
- 4017 Ben Lomond Dr
- 4044 Scripps Ave
- 4022 Ben Lomond Dr
- 265 Scripps Ct
- 230 Parkside Dr
- 279 Scripps Ct
- 251 Scripps Ct