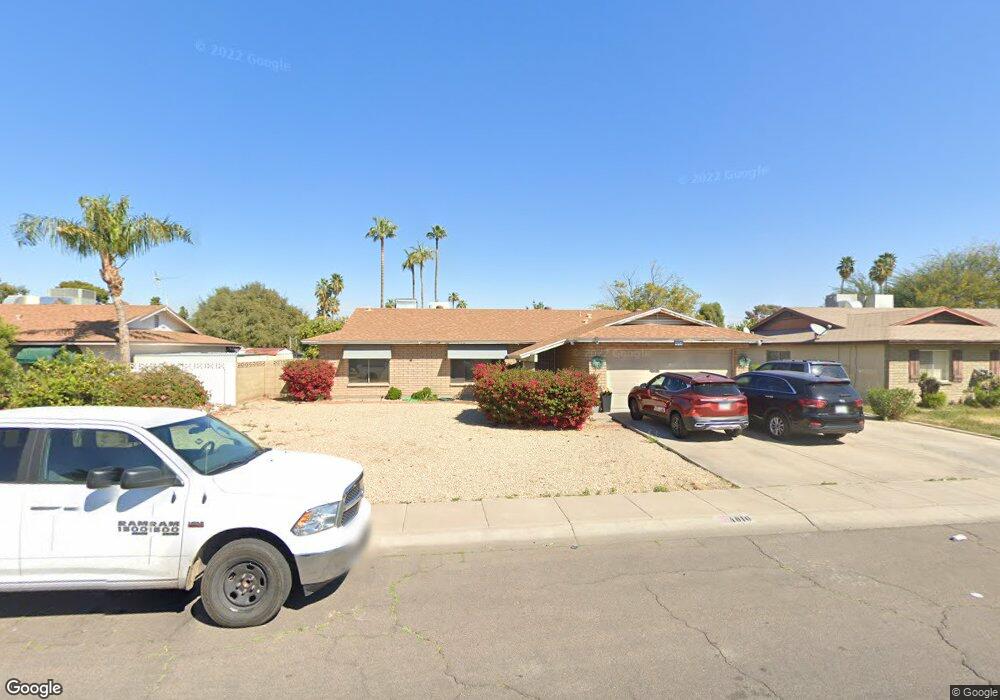
4010 W Orchid Ln Phoenix, AZ 85051
North Mountain Village NeighborhoodEstimated Value: $313,990 - $402,000
--
Bed
2
Baths
1,674
Sq Ft
$225/Sq Ft
Est. Value
About This Home
This home is located at 4010 W Orchid Ln, Phoenix, AZ 85051 and is currently estimated at $376,998, approximately $225 per square foot. 4010 W Orchid Ln is a home located in Maricopa County with nearby schools including Manzanita Elementary School, Palo Verde Middle School, and Apollo High School.
Ownership History
Date
Name
Owned For
Owner Type
Purchase Details
Closed on
Mar 7, 2006
Sold by
Haigh Karon
Bought by
Haigh Karon and Mcdarby Teri
Current Estimated Value
Home Financials for this Owner
Home Financials are based on the most recent Mortgage that was taken out on this home.
Original Mortgage
$100,500
Outstanding Balance
$56,496
Interest Rate
6.08%
Mortgage Type
New Conventional
Estimated Equity
$320,502
Purchase Details
Closed on
May 30, 1996
Sold by
Page Kenneth A and Page Katheryn J
Bought by
Haigh Karon
Home Financials for this Owner
Home Financials are based on the most recent Mortgage that was taken out on this home.
Original Mortgage
$78,950
Interest Rate
7.96%
Mortgage Type
New Conventional
Create a Home Valuation Report for This Property
The Home Valuation Report is an in-depth analysis detailing your home's value as well as a comparison with similar homes in the area
Home Values in the Area
Average Home Value in this Area
Purchase History
| Date | Buyer | Sale Price | Title Company |
|---|---|---|---|
| Haigh Karon | -- | Security Title Agency Inc | |
| Haigh Karon | $98,700 | Chicago Title Insurance Co |
Source: Public Records
Mortgage History
| Date | Status | Borrower | Loan Amount |
|---|---|---|---|
| Open | Haigh Karon | $100,500 | |
| Closed | Haigh Karon | $78,950 |
Source: Public Records
Tax History Compared to Growth
Tax History
| Year | Tax Paid | Tax Assessment Tax Assessment Total Assessment is a certain percentage of the fair market value that is determined by local assessors to be the total taxable value of land and additions on the property. | Land | Improvement |
|---|---|---|---|---|
| 2025 | $1,368 | $10,761 | -- | -- |
| 2024 | $1,131 | $10,249 | -- | -- |
| 2023 | $1,131 | $26,520 | $5,300 | $21,220 |
| 2022 | $1,091 | $20,260 | $4,050 | $16,210 |
| 2021 | $1,118 | $18,610 | $3,720 | $14,890 |
| 2020 | $1,088 | $17,180 | $3,430 | $13,750 |
| 2019 | $1,068 | $15,300 | $3,060 | $12,240 |
| 2018 | $1,038 | $14,180 | $2,830 | $11,350 |
| 2017 | $1,035 | $12,480 | $2,490 | $9,990 |
| 2016 | $1,017 | $11,730 | $2,340 | $9,390 |
| 2015 | $943 | $11,460 | $2,290 | $9,170 |
Source: Public Records
Map
Nearby Homes
- 4141 W Diana Ave
- 8514 N 38th Dr Unit 3
- 4218 W Lawrence Ln
- 3812 W Barbara Ave
- 4232 W Ruth Ave
- 8542 N 42nd Dr
- 4028 W El Camino Dr Unit 5
- 8618 N 43rd Dr
- 8230 N 42nd Dr
- 3714 W Echo Ln
- 3814 W Griswold Rd
- 4231 W El Camino Dr
- 3701 W Echo Ln Unit 4
- 3636 W Echo Ln
- 3639 W Lawrence Ln
- 4333 W Echo Ln
- 4225 W Griswold Rd
- 3718 W Puget Ave
- 4409 W Orchid Ln
- 3836 W Royal Palm Rd
- 4002 W Orchid Ln
- 4016 W Orchid Ln
- 4009 W Ruth Ave
- 4001 W Ruth Ave
- 4015 W Ruth Ave
- 8534 N 40th Ave
- 3952 W Orchid Ln
- 4022 W Orchid Ln
- 4017 W Orchid Ln
- 3951 W Ruth Ave
- 4021 W Ruth Ave
- 4023 W Orchid Ln
- 3946 W Orchid Ln
- 4028 W Orchid Ln
- 8528 N 40th Ave
- 8601 N 40th Dr
- 3945 W Ruth Ave
- 4027 W Ruth Ave
- 8602 N 40th Ave
- 4029 W Orchid Ln