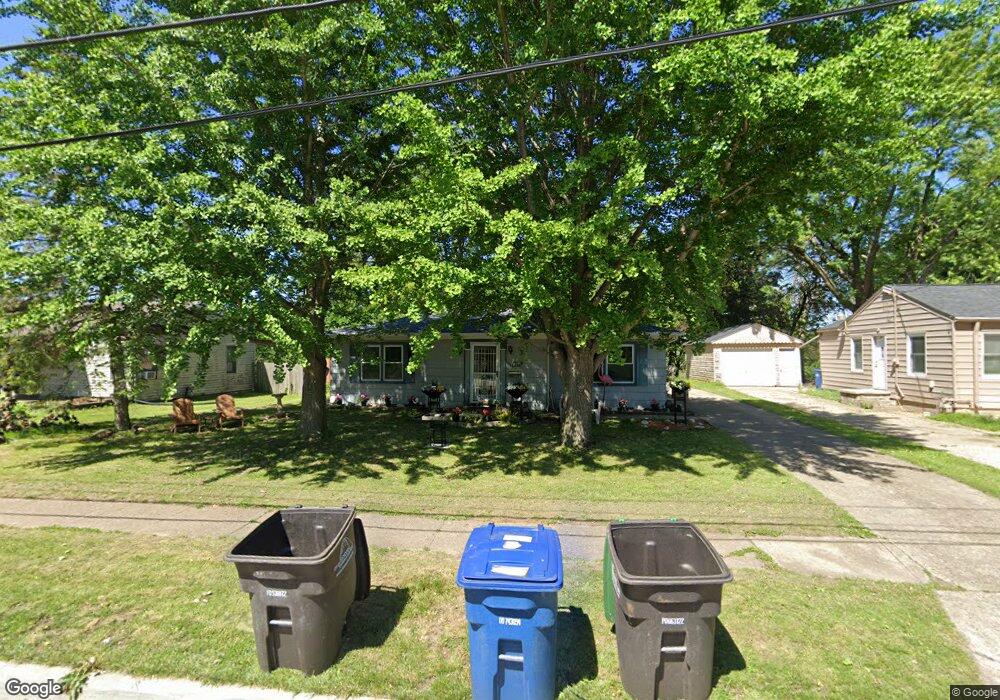
4012 15th St Des Moines, IA 50313
Oak Park NeighborhoodEstimated Value: $184,000 - $208,000
3
Beds
1
Bath
1,194
Sq Ft
$161/Sq Ft
Est. Value
About This Home
This home is located at 4012 15th St, Des Moines, IA 50313 and is currently estimated at $192,137, approximately $160 per square foot. 4012 15th St is a home located in Polk County with nearby schools including Oak Park Elementary School, Harding Middle School, and North High School.
Ownership History
Date
Name
Owned For
Owner Type
Purchase Details
Closed on
Mar 2, 2020
Sold by
Brightwell Marcie M
Bought by
Fleener Bradford
Current Estimated Value
Purchase Details
Closed on
Aug 26, 2010
Sold by
Brightwell Marcie M and Fleener Bradford J
Bought by
Brightwell Marcie M
Purchase Details
Closed on
May 20, 2010
Sold by
Brightwell Marcie M
Bought by
Brightwell Marcie M and Fleener Bradford J
Purchase Details
Closed on
Jun 24, 1998
Sold by
Baldwin Larry
Bought by
Brightwell Marcie Marie and Baldwin Mardell
Create a Home Valuation Report for This Property
The Home Valuation Report is an in-depth analysis detailing your home's value as well as a comparison with similar homes in the area
Home Values in the Area
Average Home Value in this Area
Purchase History
| Date | Buyer | Sale Price | Title Company |
|---|---|---|---|
| Fleener Bradford | -- | None Available | |
| Fleener Bradford | -- | None Available | |
| Brightwell Marcie M | -- | None Available | |
| Brightwell Marcie M | -- | None Available | |
| Brightwell Marcie M | -- | None Available | |
| Brightwell Marcie M | -- | None Available | |
| Brightwell Marcie M | -- | None Available | |
| Brightwell Marcie M | -- | None Available | |
| Brightwell Marcie Marie | -- | -- | |
| Brightwell Marcie Marie | -- | -- |
Source: Public Records
Tax History Compared to Growth
Tax History
| Year | Tax Paid | Tax Assessment Tax Assessment Total Assessment is a certain percentage of the fair market value that is determined by local assessors to be the total taxable value of land and additions on the property. | Land | Improvement |
|---|---|---|---|---|
| 2025 | $2,624 | $162,900 | $37,800 | $125,100 |
| 2024 | $2,624 | $143,900 | $32,800 | $111,100 |
| 2023 | $2,556 | $143,900 | $32,800 | $111,100 |
| 2022 | $2,534 | $117,300 | $27,700 | $89,600 |
| 2021 | $2,420 | $117,300 | $27,700 | $89,600 |
| 2020 | $2,510 | $105,600 | $24,700 | $80,900 |
| 2019 | $2,600 | $105,600 | $24,700 | $80,900 |
| 2018 | $2,570 | $105,300 | $22,500 | $82,800 |
| 2017 | $2,368 | $105,300 | $22,500 | $82,800 |
| 2016 | $2,302 | $96,100 | $20,300 | $75,800 |
| 2015 | $2,302 | $96,100 | $20,300 | $75,800 |
| 2014 | $2,316 | $95,900 | $19,800 | $76,100 |
Source: Public Records
Map
Nearby Homes