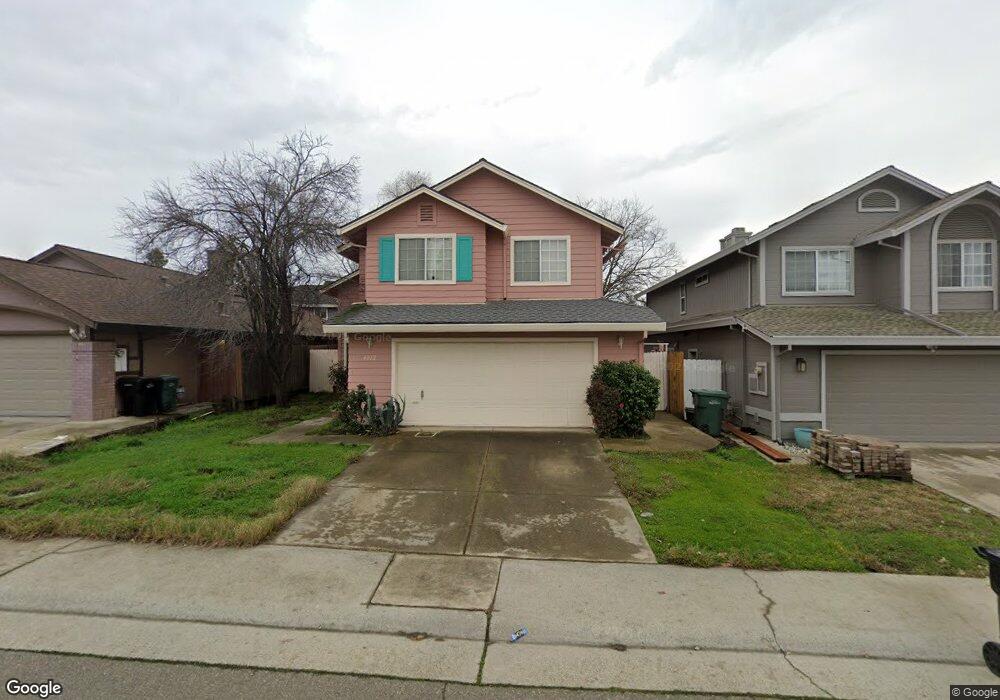
4012 Grey Livery Way Antelope, CA 95843
Estimated Value: $503,013 - $551,000
4
Beds
3
Baths
2,060
Sq Ft
$255/Sq Ft
Est. Value
About This Home
This home is located at 4012 Grey Livery Way, Antelope, CA 95843 and is currently estimated at $526,253, approximately $255 per square foot. 4012 Grey Livery Way is a home located in Sacramento County with nearby schools including Oak Hill Elementary School, Wilson C. Riles Middle School, and Center High School.
Ownership History
Date
Name
Owned For
Owner Type
Purchase Details
Closed on
Sep 16, 2020
Sold by
Gumbsweeks Margaretta Pamela and Gumbs Margaretta Pamela
Bought by
Gumbsweeks Margaretta Pamela
Current Estimated Value
Home Financials for this Owner
Home Financials are based on the most recent Mortgage that was taken out on this home.
Original Mortgage
$119,700
Outstanding Balance
$64,176
Interest Rate
2.9%
Mortgage Type
New Conventional
Estimated Equity
$462,077
Purchase Details
Closed on
Dec 28, 1994
Sold by
Michelsen Phillip Ellis and Michelsen Joan Louise
Bought by
Gumbs Margaretta Pamela
Home Financials for this Owner
Home Financials are based on the most recent Mortgage that was taken out on this home.
Original Mortgage
$157,590
Interest Rate
9.27%
Mortgage Type
Assumption
Create a Home Valuation Report for This Property
The Home Valuation Report is an in-depth analysis detailing your home's value as well as a comparison with similar homes in the area
Home Values in the Area
Average Home Value in this Area
Purchase History
| Date | Buyer | Sale Price | Title Company |
|---|---|---|---|
| Gumbsweeks Margaretta Pamela | -- | Orange Coast Title Company | |
| Gumbs Margaretta Pamela | $157,000 | Fidelity National Title |
Source: Public Records
Mortgage History
| Date | Status | Borrower | Loan Amount |
|---|---|---|---|
| Open | Gumbsweeks Margaretta Pamela | $119,700 | |
| Previous Owner | Gumbs Margaretta Pamela | $157,590 |
Source: Public Records
Tax History Compared to Growth
Tax History
| Year | Tax Paid | Tax Assessment Tax Assessment Total Assessment is a certain percentage of the fair market value that is determined by local assessors to be the total taxable value of land and additions on the property. | Land | Improvement |
|---|---|---|---|---|
| 2025 | $3,015 | $259,480 | $67,170 | $192,310 |
| 2024 | $3,015 | $254,393 | $65,853 | $188,540 |
| 2023 | $2,949 | $249,406 | $64,562 | $184,844 |
| 2022 | $2,922 | $244,517 | $63,297 | $181,220 |
| 2021 | $2,997 | $239,723 | $62,056 | $177,667 |
| 2020 | $3,226 | $237,266 | $61,420 | $175,846 |
| 2019 | $2,941 | $232,615 | $60,216 | $172,399 |
| 2018 | $2,873 | $228,055 | $59,036 | $169,019 |
| 2017 | $2,786 | $223,584 | $57,879 | $165,705 |
| 2016 | $2,733 | $219,201 | $56,745 | $162,456 |
| 2015 | $2,538 | $215,909 | $55,893 | $160,016 |
| 2014 | $2,588 | $211,681 | $54,799 | $156,882 |
Source: Public Records
Map
Nearby Homes
- 3912 Tawny Meadow Way
- 4016 Diane Dr
- 8445 Bramble Bush Cir
- 8300 Scrub Oak Way
- 8321 Scrub Oak Way
- 8400 Clear Valley Ct
- 4229 Shandwick Dr
- 8121 Deer Spring Cir
- 9416 Redwater Dr
- 8036 Golden Ring Way
- 4253 Hartlepool Way
- 4112 Copper Hill Ct
- 8253 Northam Dr
- 8020 Walerga Rd Unit 3
- 8020 Walerga Rd Unit 1195
- 8020 Walerga Rd Unit 1061
- 8525 Sutter Creek Way
- 8216 Bellsbrae Dr
- 8434 Walerga Rd Unit 1211
- 8434 Walerga Rd Unit 1011
- 4008 Grey Livery Way
- 4016 Grey Livery Way
- 8167 Gloriann Way
- 4004 Grey Livery Way
- 4021 Honey Rose Place
- 8163 Gloriann Way
- 4000 Grey Livery Way
- 4017 Honey Rose Place
- 4013 Grey Livery Way
- 4009 Grey Livery Way
- 4024 Grey Livery Way
- 4025 Honey Rose Place
- 4017 Grey Livery Way
- 4005 Grey Livery Way
- 3964 Grey Livery Way
- 4013 Honey Rose Place
- 4021 Grey Livery Way
- 8159 Gloriann Way
- 4001 Grey Livery Way
- 4028 Grey Livery Way