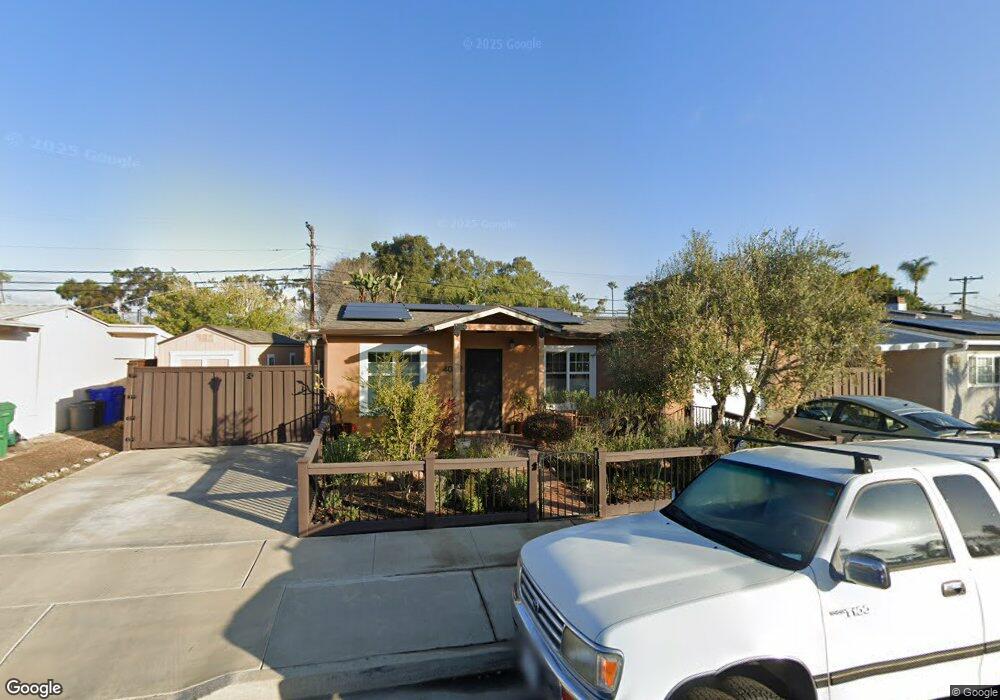
4012 Willamette Ave San Diego, CA 92117
North Clairemont NeighborhoodEstimated Value: $995,697 - $1,187,000
3
Beds
2
Baths
1,290
Sq Ft
$837/Sq Ft
Est. Value
About This Home
This home is located at 4012 Willamette Ave, San Diego, CA 92117 and is currently estimated at $1,080,174, approximately $837 per square foot. 4012 Willamette Ave is a home located in San Diego County with nearby schools including Field Elementary School, Innovation Middle School, and Madison High School.
Ownership History
Date
Name
Owned For
Owner Type
Purchase Details
Closed on
Jul 12, 2005
Sold by
Taylor Steven and Taylor Leah
Bought by
Taylor Steven W and Siegel Leah Peri
Current Estimated Value
Purchase Details
Closed on
Nov 16, 2000
Sold by
Adeboi Robert P and Adeboi Dee A
Bought by
Taylor Steven and Taylor Leah
Home Financials for this Owner
Home Financials are based on the most recent Mortgage that was taken out on this home.
Original Mortgage
$256,500
Outstanding Balance
$93,030
Interest Rate
7.66%
Estimated Equity
$987,144
Purchase Details
Closed on
Apr 28, 1995
Sold by
Kisselstein Gay R
Bought by
Adeboi Robert Peter and Adeboi Dee Anna
Home Financials for this Owner
Home Financials are based on the most recent Mortgage that was taken out on this home.
Original Mortgage
$140,600
Interest Rate
8.44%
Create a Home Valuation Report for This Property
The Home Valuation Report is an in-depth analysis detailing your home's value as well as a comparison with similar homes in the area
Home Values in the Area
Average Home Value in this Area
Purchase History
| Date | Buyer | Sale Price | Title Company |
|---|---|---|---|
| Taylor Steven W | -- | -- | |
| Taylor Steven | $270,000 | Southland Title | |
| Adeboi Robert Peter | $148,000 | First American Title Co |
Source: Public Records
Mortgage History
| Date | Status | Borrower | Loan Amount |
|---|---|---|---|
| Open | Taylor Steven | $256,500 | |
| Previous Owner | Adeboi Robert Peter | $140,600 |
Source: Public Records
Tax History Compared to Growth
Tax History
| Year | Tax Paid | Tax Assessment Tax Assessment Total Assessment is a certain percentage of the fair market value that is determined by local assessors to be the total taxable value of land and additions on the property. | Land | Improvement |
|---|---|---|---|---|
| 2025 | $4,844 | $406,522 | $241,083 | $165,439 |
| 2024 | $4,844 | $398,552 | $236,356 | $162,196 |
| 2023 | $4,735 | $390,738 | $231,722 | $159,016 |
| 2022 | $4,607 | $383,078 | $227,179 | $155,899 |
| 2021 | $4,661 | $375,568 | $222,725 | $152,843 |
| 2020 | $4,604 | $371,718 | $220,442 | $151,276 |
| 2019 | $4,523 | $364,430 | $216,120 | $148,310 |
| 2018 | $4,229 | $357,285 | $211,883 | $145,402 |
| 2017 | $4,129 | $350,280 | $207,729 | $142,551 |
| 2016 | $4,062 | $343,412 | $203,656 | $139,756 |
| 2015 | $4,003 | $338,254 | $200,597 | $137,657 |
| 2014 | $3,858 | $331,629 | $196,668 | $134,961 |
Source: Public Records
Map
Nearby Homes
- 4576 Onondaga Ave
- 4182 Seri St
- 4380 Rolfe Rd
- 3571 Idlewild Way
- 3582 Hatteras Ave
- 4203 Tolowa St
- 3701 Tavara Cir
- 3476 Ogalala Ave
- 4527 Kickapoo Ct
- 4527 Chinook Ct
- 4851 Cole St Unit 1
- 4472 Mount Lindsey Ave
- 4875 Cole St Unit 69
- 4875 Cole St Unit 51
- 4034 Conrad Ave
- 3822 Conrad Ave
- 4401-3 Clairemont Mesa Blvd
- 4543 Moraga Ave
- 4501 Bannock Ave
- 5020 Cole St
- 4004 Willamette Ave
- 4020 Willamette Ave
- 3939 Clairemont Mesa Blvd Unit 41
- 4021 Willamette Ave
- 3944 Willamette Ave
- 4028 Willamette Ave
- 3945 Clairemont Mesa Blvd Unit 47
- 3931 Clairemont Mesa Blvd Unit 33
- 4011 Willamette Ave
- 3955 Clairemont Mesa Blvd
- 4019 Willamette Ave
- 4003 Willamette Ave
- 3934 Willamette Ave
- 4036 Willamette Ave
- 4027 Willamette Ave
- 3925 Clairemont Mesa Blvd Unit 27
- 3961 Clairemont Mesa Blvd Unit 63
- 4035 Willamette Ave
- 3924 Willamette Ave
- 4044 Willamette Ave