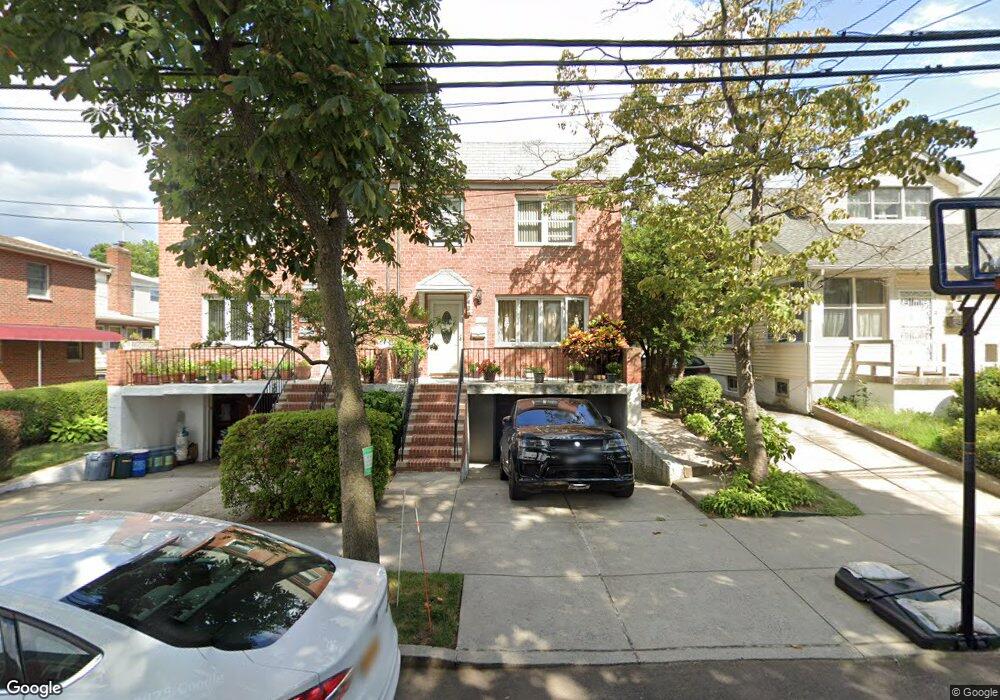
4015 189th St Flushing, NY 11358
Murray Hill-Broadway NeighborhoodEstimated Value: $946,000 - $1,081,000
Studio
--
Bath
1,480
Sq Ft
$682/Sq Ft
Est. Value
About This Home
This home is located at 4015 189th St, Flushing, NY 11358 and is currently estimated at $1,008,682, approximately $681 per square foot. 4015 189th St is a home located in Queens County with nearby schools including P.S. 31 - Bayside, I.S. 25 Adrien Block, and Francis Lewis High School.
Ownership History
Date
Name
Owned For
Owner Type
Purchase Details
Closed on
Nov 15, 2022
Sold by
Tsevis Evagelia
Bought by
Roditis Helen and Tsevis Vasilios
Current Estimated Value
Purchase Details
Closed on
Sep 20, 2021
Sold by
Roditis Helen and Tsevis Evagelia
Bought by
Tsevis Evagelia
Purchase Details
Closed on
Aug 11, 2017
Sold by
Tsevis Evagelia
Bought by
Roditis Helen and Tsevis Evagelia
Home Financials for this Owner
Home Financials are based on the most recent Mortgage that was taken out on this home.
Original Mortgage
$300,000
Outstanding Balance
$250,798
Interest Rate
4.03%
Mortgage Type
Purchase Money Mortgage
Estimated Equity
$757,884
Purchase Details
Closed on
Nov 8, 2001
Sold by
Karacostas Nicholas A and Karacostas Anna
Bought by
Tsevis Evagelia
Home Financials for this Owner
Home Financials are based on the most recent Mortgage that was taken out on this home.
Original Mortgage
$270,000
Interest Rate
6.6%
Create a Home Valuation Report for This Property
The Home Valuation Report is an in-depth analysis detailing your home's value as well as a comparison with similar homes in the area
Home Values in the Area
Average Home Value in this Area
Purchase History
| Date | Buyer | Sale Price | Title Company |
|---|---|---|---|
| Roditis Helen | -- | -- | |
| Tsevis Evagelia | -- | -- | |
| Roditis Helen | -- | -- | |
| Tsevis Evagelia | -- | -- |
Source: Public Records
Mortgage History
| Date | Status | Borrower | Loan Amount |
|---|---|---|---|
| Open | Roditis Helen | $300,000 | |
| Previous Owner | Tsevis Evagelia | $270,000 |
Source: Public Records
Tax History
| Year | Tax Paid | Tax Assessment Tax Assessment Total Assessment is a certain percentage of the fair market value that is determined by local assessors to be the total taxable value of land and additions on the property. | Land | Improvement |
|---|---|---|---|---|
| 2025 | $7,996 | $42,200 | $11,482 | $30,718 |
| 2024 | $3,998 | $39,812 | $12,071 | $27,741 |
| 2023 | $3,998 | $39,812 | $13,355 | $26,457 |
| 2022 | $3,934 | $49,800 | $15,900 | $33,900 |
| 2021 | $7,845 | $52,380 | $15,900 | $36,480 |
| 2020 | $7,444 | $52,920 | $15,900 | $37,020 |
| 2019 | $6,940 | $52,200 | $15,900 | $36,300 |
| 2018 | $6,940 | $33,177 | $10,935 | $22,242 |
| 2016 | $5,589 | $31,063 | $10,663 | $20,400 |
| 2015 | $3,111 | $29,306 | $13,462 | $15,844 |
| 2014 | $3,111 | $27,648 | $13,570 | $14,078 |
Source: Public Records
Map
Nearby Homes
- 190-17 42nd Ave
- 19112 Station Rd
- 189-23 39th Ave Unit 122
- 191-02 39th Ave
- 190-05 39th Ave Unit 142
- 191-9 39th Ave Unit 164
- 42-25 189th St
- 42-28 189th St
- 36-20 190th St
- 45 24 171st St
- 36-44 172 St Unit 93
- 193-02 39th Ave Unit 1
- 36-35 171st St Unit 30
- 3639 171st St Unit 26
- 172-12 Crocheron Ave Unit C3
- 40-38 194th St Unit 1A
- 4038 194th St Unit 3B
- 188-02 Northern Blvd
- 4048 194th St Unit A3
- 36-07 171st St Unit 35
- 4011 189th St
- 4017 189th St
- 4007 189th St
- 40-21 189th St
- 40-15 189th St
- 4021 189th St
- 18908 Station Rd
- 18910 Station Rd
- 4014 190th St
- 40-14 190th St Unit 2FL
- 4012 190th St
- 18912 Station Rd
- 4018 190th St
- 4005 189th St
- 40-24 189th St
- 40-24 189th St
- 18914 Station Rd
- 40-18 190th St
- 189-12 Station Rd
- 40-18 189th St
Your Personal Tour Guide
Ask me questions while you tour the home.