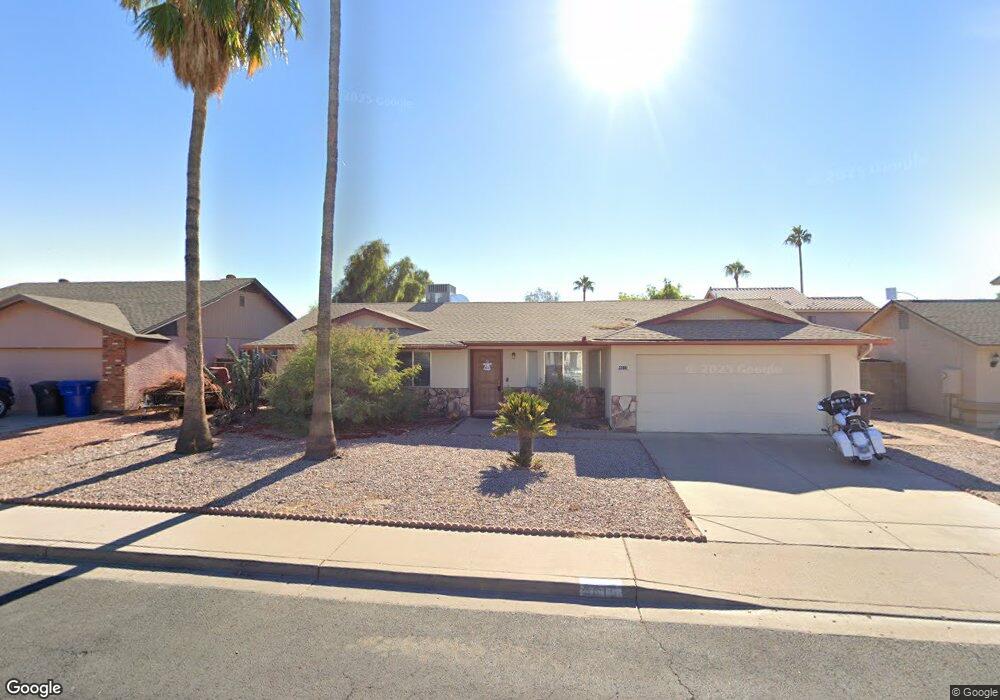
4015 E Downing St Mesa, AZ 85205
The Groves NeighborhoodEstimated Value: $392,425 - $439,000
Studio
2
Baths
1,362
Sq Ft
$308/Sq Ft
Est. Value
About This Home
This home is located at 4015 E Downing St, Mesa, AZ 85205 and is currently estimated at $419,356, approximately $307 per square foot. 4015 E Downing St is a home located in Maricopa County with nearby schools including Entz Elementary School, Franklin at Brimhall Elementary School, and Franklin West Elementary School.
Ownership History
Date
Name
Owned For
Owner Type
Purchase Details
Closed on
Jun 27, 2024
Sold by
Oscar Gene Williams and Oscar Jacquelyn Willia
Bought by
Williams Christianna
Current Estimated Value
Home Financials for this Owner
Home Financials are based on the most recent Mortgage that was taken out on this home.
Original Mortgage
$265,995
Outstanding Balance
$262,836
Interest Rate
7.02%
Mortgage Type
New Conventional
Estimated Equity
$156,520
Purchase Details
Closed on
May 23, 2008
Sold by
Laws John W and Laws Barbara
Bought by
Laws Sean Michael and Sean Michael Laws Family Trust
Purchase Details
Closed on
Apr 21, 2004
Sold by
Williams Oscar G and Williams Jacquelyn
Bought by
Williams Oscar Gene and Williams Jacquelyn
Purchase Details
Closed on
Nov 10, 1995
Sold by
Mostek Marie S and Battaglia Ralph N
Bought by
Williams Oscar G and Williams Jacquelyn
Purchase Details
Closed on
Aug 28, 1995
Sold by
Mostek Marie S
Bought by
Mostek Marie S and Battaglia Ralph N
Create a Home Valuation Report for This Property
The Home Valuation Report is an in-depth analysis detailing your home's value as well as a comparison with similar homes in the area
Home Values in the Area
Average Home Value in this Area
Purchase History
| Date | Buyer | Sale Price | Title Company |
|---|---|---|---|
| Williams Christianna | $392,400 | Landmark Title | |
| Laws Sean Michael | -- | Chicago Title | |
| Williams Oscar Gene | -- | -- | |
| Williams Oscar G | $88,000 | First American Title | |
| Mostek Marie S | -- | -- |
Source: Public Records
Mortgage History
| Date | Status | Borrower | Loan Amount |
|---|---|---|---|
| Open | Williams Christianna | $265,995 |
Source: Public Records
Tax History
| Year | Tax Paid | Tax Assessment Tax Assessment Total Assessment is a certain percentage of the fair market value that is determined by local assessors to be the total taxable value of land and additions on the property. | Land | Improvement |
|---|---|---|---|---|
| 2025 | $1,286 | $15,070 | -- | -- |
| 2024 | $1,299 | $14,352 | -- | -- |
| 2023 | $1,299 | $28,780 | $5,750 | $23,030 |
| 2022 | $1,271 | $22,360 | $4,470 | $17,890 |
| 2021 | $1,300 | $20,880 | $4,170 | $16,710 |
| 2020 | $1,282 | $19,030 | $3,800 | $15,230 |
| 2019 | $1,189 | $17,100 | $3,420 | $13,680 |
| 2018 | $1,134 | $15,580 | $3,110 | $12,470 |
| 2017 | $1,099 | $14,370 | $2,870 | $11,500 |
| 2016 | $1,079 | $13,900 | $2,780 | $11,120 |
| 2015 | $1,017 | $13,000 | $2,600 | $10,400 |
Source: Public Records
Map
Nearby Homes
- 3920 E Ellis St
- 625 N 38th St
- 3746 E Dartmouth St
- 3721 E Adobe St
- 3716 E Dartmouth St
- 3739 E Enrose St
- 3856 E Fairfield St
- 3931 E Fox Cir
- 526 N Merino
- 4065 E University Dr Unit 157
- 746 N Bermuda
- 1126 N Nassau
- 4245 E Fountain St
- 3716 E University Dr Unit 2030
- 3716 E University Dr Unit 2014
- 3716 E University Dr Unit 2016
- 3716 E University Dr Unit C2010
- 4429 E Downing Cir
- 4065 E University Dr Unit 433
- 4065 E University Dr Unit 50
- 4023 E Downing St
- 4007 E Downing St
- 721 N Nassau
- 718 N Jackson Cir
- 4031 E Downing St
- 715 N Nassau Unit 3
- 4016 E Downing St
- 4024 E Downing St
- 4008 E Downing St
- 4039 E Downing St
- 721 N Jackson Cir
- 4032 E Downing St
- 732 N Nassau
- 732 N Nassau
- 710 N Jackson Cir Unit 3
- 724 N Nassau
- 709 N Nassau Unit 3
- 740 N Nassau
- 4040 E Downing St
- 4019 E Adobe St
Your Personal Tour Guide
Ask me questions while you tour the home.