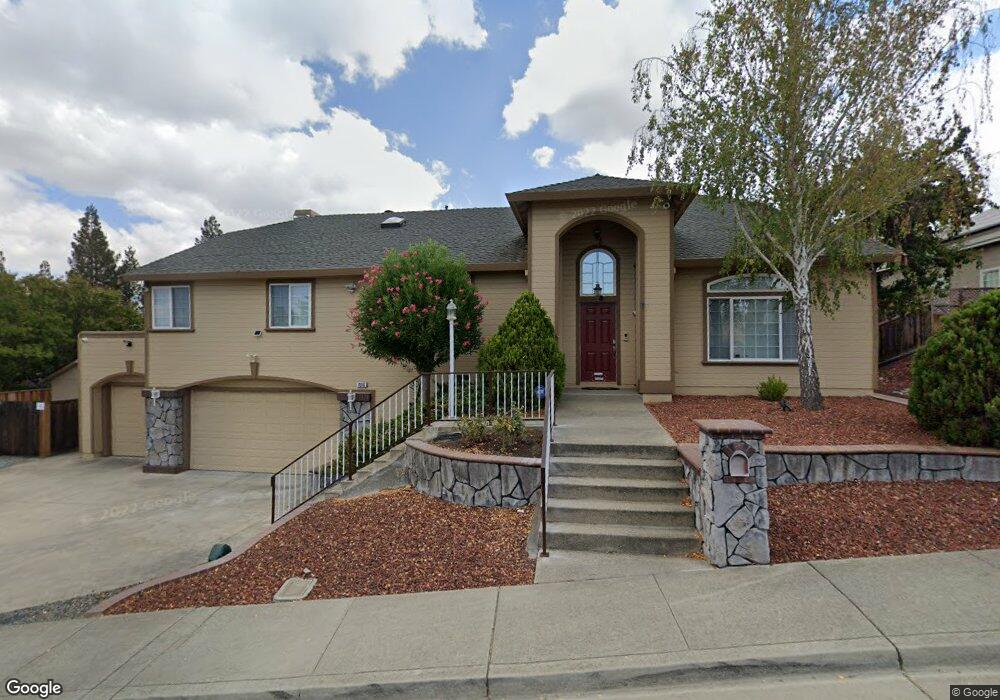
4016 Browning Dr Concord, CA 94518
Cowell Terrace NeighborhoodEstimated Value: $1,314,000 - $1,463,350
4
Beds
3
Baths
2,619
Sq Ft
$530/Sq Ft
Est. Value
About This Home
This home is located at 4016 Browning Dr, Concord, CA 94518 and is currently estimated at $1,389,338, approximately $530 per square foot. 4016 Browning Dr is a home located in Contra Costa County with nearby schools including El Monte Elementary School, El Dorado Middle School, and Concord High School.
Ownership History
Date
Name
Owned For
Owner Type
Purchase Details
Closed on
Aug 14, 2024
Sold by
Noto Joseph and Noto Gwendolyn
Bought by
Joseph & Gwendolyn Noto Family Trust and Noto
Current Estimated Value
Purchase Details
Closed on
Jul 12, 2005
Sold by
Hardy Leonard Joseph and Hardy Bernadette
Bought by
Noto Joseph and Noto Gwendolyn
Home Financials for this Owner
Home Financials are based on the most recent Mortgage that was taken out on this home.
Original Mortgage
$315,000
Interest Rate
5.55%
Mortgage Type
Fannie Mae Freddie Mac
Purchase Details
Closed on
Feb 18, 1994
Sold by
Concord Homes 88
Bought by
Hardy Leonard Joseph and Hardy Bernadette
Create a Home Valuation Report for This Property
The Home Valuation Report is an in-depth analysis detailing your home's value as well as a comparison with similar homes in the area
Home Values in the Area
Average Home Value in this Area
Purchase History
We collect this data history from publicly available records. To have your information removed, we recommend requesting removal directly through your county’s website.
| Date | Buyer | Sale Price | Title Company |
|---|---|---|---|
| Joseph & Gwendolyn Noto Family Trust | -- | None Listed On Document | |
| Noto Joseph | $975,000 | North American Title | |
| Hardy Leonard Joseph | $107,000 | Old Republic Title Company |
Source: Public Records
Mortgage History
We collect this data history from publicly available records. To have your information removed, we recommend requesting removal directly through your county’s website.
| Date | Status | Borrower | Loan Amount |
|---|---|---|---|
| Previous Owner | Noto Joseph | $315,000 |
Source: Public Records
Tax History
| Year | Tax Paid | Tax Assessment Tax Assessment Total Assessment is a certain percentage of the fair market value that is determined by local assessors to be the total taxable value of land and additions on the property. | Land | Improvement |
|---|---|---|---|---|
| 2025 | $16,228 | $1,386,397 | $526,125 | $860,272 |
| 2024 | $15,573 | $1,359,213 | $515,809 | $843,404 |
| 2023 | $15,573 | $1,332,563 | $505,696 | $826,867 |
| 2022 | $15,401 | $1,306,435 | $495,781 | $810,654 |
| 2021 | $12,251 | $1,030,000 | $390,876 | $639,124 |
| 2019 | $11,358 | $940,000 | $356,723 | $583,277 |
| 2018 | $10,791 | $908,500 | $344,769 | $563,731 |
| 2017 | $10,344 | $881,500 | $334,523 | $546,977 |
| 2016 | $10,105 | $866,000 | $328,641 | $537,359 |
| 2015 | $9,165 | $776,000 | $294,487 | $481,513 |
| 2014 | $8,553 | $718,500 | $272,666 | $445,834 |
Source: Public Records
Map
Nearby Homes
- 1051 Tilley Cir
- 1167 Kaski Ln
- 3789 Northridge Dr Unit 7
- 3739 Northridge Dr
- 1167 Saint Matthew Place Unit 102
- 4058 Treat Blvd
- 4044 Cowell Rd
- 941 Tyler Ct
- 4362 Lynn Dr
- 978 Via Montanas
- 1200 Stonecrest Ln
- 0 Cowell Rd
- 4345 Rose Ln
- 4311 Cowell Rd
- 4321 Cowell Rd
- 1162 Ridgewood Dr
- 1201 Sheridan Rd
- 1219 Saint Elizabeth Ct
- 3772 Gainsborough Dr
- 4324 Chelsea Way
- 4012 Browning Dr
- 1081 Kipling Ct
- 4020 Browning Dr
- 1087 Kipling Ct
- 4017 Browning Dr
- 1075 Kipling Ct
- 4013 Browning Dr
- 4021 Browning Dr
- 4008 Browning Dr
- 4024 Browning Dr
- 1093 Kipling Ct
- 1069 Kipling Ct
- 1074 Kipling Ct
- 4009 Browning Dr
- 1086 Kipling Ct
- 4025 Browning Dr
- 732 Court Ln
- 1068 Jamie Dr
- 724 Court Ln
- 1068 Kipling Ct
Your Personal Tour Guide
Ask me questions while you tour the home.