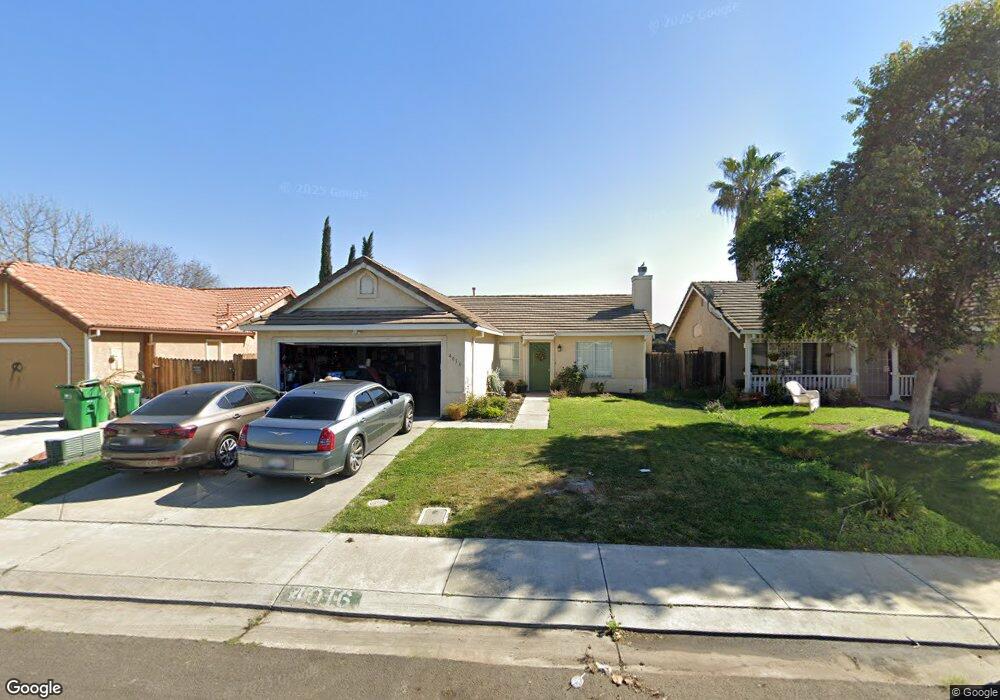
4016 Kimball Ln Stockton, CA 95206
South Stockton NeighborhoodEstimated Value: $307,000 - $402,000
3
Beds
2
Baths
1,120
Sq Ft
$325/Sq Ft
Est. Value
About This Home
This home is located at 4016 Kimball Ln, Stockton, CA 95206 and is currently estimated at $364,469, approximately $325 per square foot. 4016 Kimball Ln is a home located in San Joaquin County with nearby schools including Monroe Elementary School, Alexander Hamilton Elementary, and Van Buren Elementary School.
Ownership History
Date
Name
Owned For
Owner Type
Purchase Details
Closed on
Feb 7, 2015
Sold by
Phonpradith Say
Bought by
Phonpradith Sengthip
Current Estimated Value
Purchase Details
Closed on
Jul 23, 2009
Sold by
Gmac Mortgage Llc
Bought by
Phonpradith Say and Phonpradith Sengthip
Purchase Details
Closed on
Jun 11, 2009
Sold by
Canton Leo and Canton Luz
Bought by
Gmac Mortgage Llc and Gmac Mortgage Corporation
Purchase Details
Closed on
Nov 29, 2004
Sold by
Tinaco Pedro B
Bought by
Canton Leo and Canton Luz
Home Financials for this Owner
Home Financials are based on the most recent Mortgage that was taken out on this home.
Original Mortgage
$26,800
Interest Rate
5.65%
Mortgage Type
Credit Line Revolving
Purchase Details
Closed on
Mar 21, 1994
Sold by
Little John Creek Partnership
Bought by
Tinaco Pedro B
Home Financials for this Owner
Home Financials are based on the most recent Mortgage that was taken out on this home.
Original Mortgage
$75,900
Interest Rate
7.15%
Create a Home Valuation Report for This Property
The Home Valuation Report is an in-depth analysis detailing your home's value as well as a comparison with similar homes in the area
Home Values in the Area
Average Home Value in this Area
Purchase History
| Date | Buyer | Sale Price | Title Company |
|---|---|---|---|
| Phonpradith Sengthip | -- | None Available | |
| Phonpradith Say | $78,000 | First American Title Company | |
| Gmac Mortgage Llc | $71,400 | None Available | |
| Canton Leo | $268,000 | Fidelity Natl Title Ins Co | |
| Tinaco Pedro B | $96,000 | Old Republic Title Co |
Source: Public Records
Mortgage History
| Date | Status | Borrower | Loan Amount |
|---|---|---|---|
| Previous Owner | Canton Leo | $26,800 | |
| Previous Owner | Tinaco Pedro B | $75,900 | |
| Closed | Canton Leo | $214,400 |
Source: Public Records
Tax History Compared to Growth
Tax History
| Year | Tax Paid | Tax Assessment Tax Assessment Total Assessment is a certain percentage of the fair market value that is determined by local assessors to be the total taxable value of land and additions on the property. | Land | Improvement |
|---|---|---|---|---|
| 2025 | $3,259 | $100,674 | $24,521 | $76,153 |
| 2024 | $3,252 | $98,701 | $24,041 | $74,660 |
| 2023 | $3,264 | $96,767 | $23,570 | $73,197 |
| 2022 | $4,479 | $94,870 | $23,108 | $71,762 |
| 2021 | $1,350 | $93,010 | $22,655 | $70,355 |
| 2020 | $1,372 | $92,057 | $22,423 | $69,634 |
| 2019 | $1,355 | $90,253 | $21,984 | $68,269 |
| 2018 | $1,326 | $88,484 | $21,553 | $66,931 |
| 2017 | $1,239 | $86,750 | $21,131 | $65,619 |
| 2016 | $1,246 | $85,049 | $20,717 | $64,332 |
| 2014 | $1,193 | $82,133 | $20,007 | $62,126 |
Source: Public Records
Map
Nearby Homes
- 3226 Vermillion Dr
- 4032 California 99 Unit 3
- 4326 Highbridge Ln
- 2343 Tidewind Dr
- 3435 Marfargoa Rd Unit 74
- Plan 2541 at Parkside at Kennedy Ranch
- Plan 2308 Modeled at Parkside at Kennedy Ranch
- Plan 1934 Modeled at Parkside at Kennedy Ranch
- Plan 1718 at Parkside at Kennedy Ranch
- Plan 1481 Modeled at Parkside at Kennedy Ranch
- 2321 Amboy Ave
- 2150 Michael Ave
- 2288 E Loomis Rd
- 2328 E Loomis Rd
- 2348 E Loomis Rd
- 2318 E Loomis Rd
- 3338 Zamora Way
- 3349 Zamora Way
- 3028 Malisa Way
- 3204 Volney St
- 4028 Kimball Ln
- 4004 Kimball Ln
- 2926 Togninali Ln
- 4040 Kimball Ln
- 2907 Fairbury Ln
- 2938 Togninali Ln
- 2888 Togninali Ln
- 2841 Nemaha Way
- 4052 Kimball Ln
- 4009 Minden Ln
- 2950 Togninali Ln
- 2876 Togninali Ln
- 2833 Nemaha Way
- 4110 Kimball Ln
- 2915 Fairbury Ln
- 2913 Togninali Ln
- 2901 Togninali Ln
- 2925 Togninali Ln
- 4017 Minden Ln
- 2962 Togninali Ln