

402 38th St Newport Beach, CA 92663
West Newport Beach Neighborhood
3
Beds
3
Baths
2,629
Sq Ft
3,000
Sq Ft Lot
Highlights
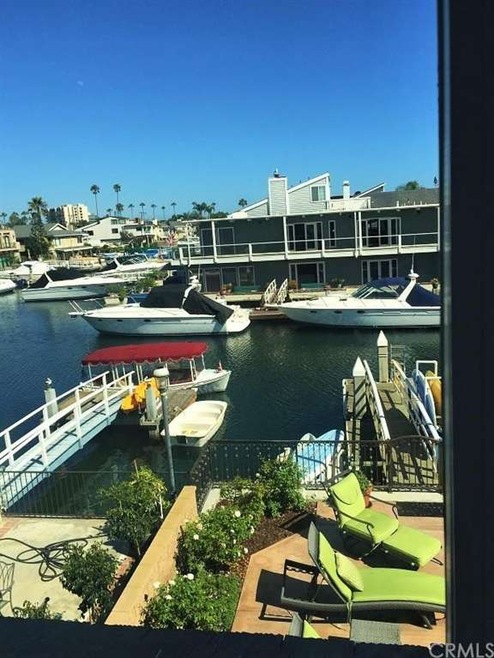
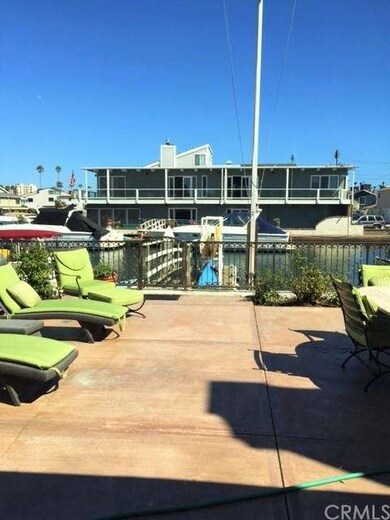
- Bay View
- Home fronts a canal
- Walk-In Pantry
- Newport Elementary School Rated A
- No HOA
- 2-minute walk to 38th Street Park
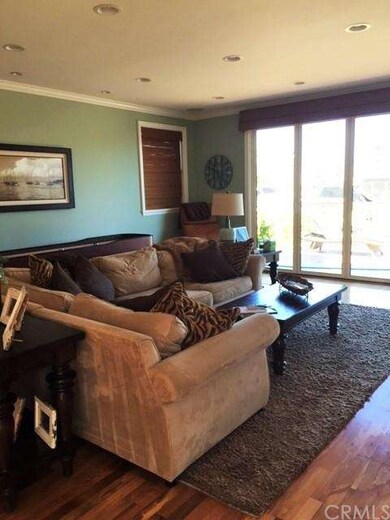
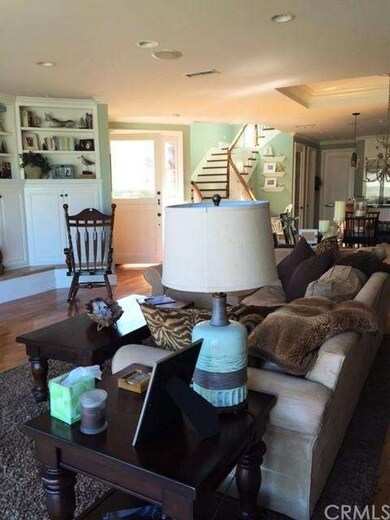
About This Home
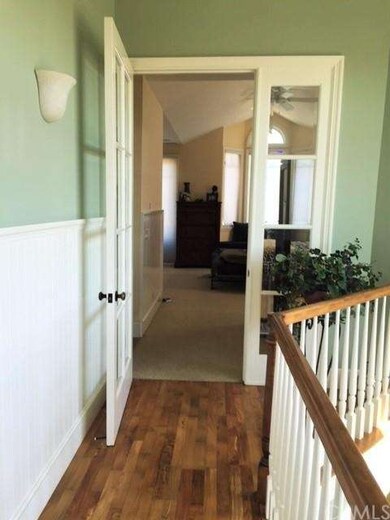
As of April 2025Live in one of Orange County's most exclusive areas, Newport Island. Rebuilt in 2001 and located in a gorgeous neighborhood just a short distance to the beach. Already move-in-friendly this home encompasses 3 bedrooms and 3 bathrooms, this home exudes fine Newport Beach living. Enjoy the sunshine on your own private dock!
Last Agent to Sell the Property
The Oppenheim Group License #01132839 Listed on: 08/07/2015
Co-Listed By
Adriana Leite
Century 21 Masters License #01913263
Home Details
Home Type
- Single Family
Est. Annual Taxes
- $40,692
Year Built
- Built in 2001
Lot Details
- 3,000 Sq Ft Lot
- Home fronts a canal
Parking
- 2 Car Garage
Property Views
- Bay
- Canal
Interior Spaces
- 2,629 Sq Ft Home
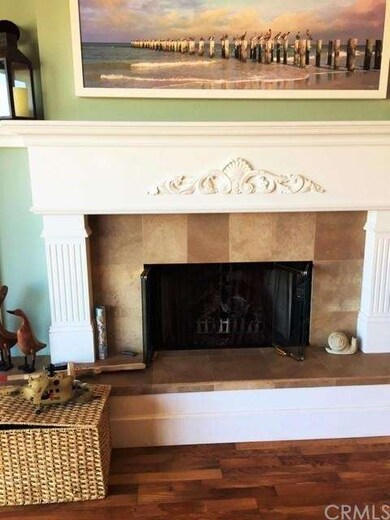
- Gas Fireplace
- Living Room with Fireplace
- Walk-In Pantry
Bedrooms and Bathrooms
- 3 Bedrooms
- 3 Full Bathrooms
Utilities
- Central Air
Community Details
- No Home Owners Association
Listing and Financial Details
- Tax Lot 2
- Tax Tract Number 164
- Assessor Parcel Number 42307308
Ownership History
Date
Name
Owned For
Owner Type
Purchase Details
Listed on
Feb 20, 2025
Closed on
Mar 6, 2025
Sold by
402 38Th St Llc
Bought by
Rim Properties Llc
Seller's Agent
Nicolai Glazer
Pacific Sotheby's Int'l Realty
Buyer's Agent
Amelie Mason
Pacific Sotheby's Int'l Realty
List Price
$6,500,000
Sold Price
$6,250,000
Premium/Discount to List
-$250,000
-3.85%
Total Days on Market
10
Views
138
Home Financials for this Owner
Home Financials are based on the most recent Mortgage that was taken out on this home.
Avg. Annual Appreciation
21.08%
Purchase Details
Closed on
Apr 11, 2020
Sold by
Ye Mason Foster
Bought by
402 38Th St Llc
Purchase Details
Closed on
Apr 9, 2020
Sold by
Jia Yunping
Bought by
Ye Mason Foster and The Leafport Trust
Purchase Details
Closed on
Jan 16, 2018
Sold by
Ye Qing
Bought by
Ye Qing and Jia Yanping
Purchase Details
Listed on
Aug 7, 2015
Closed on
Aug 18, 2015
Sold by
Hansen Peter A and Hansen Carolyn S
Bought by
Ye Qing
Seller's Agent
Noemi Romero
The Oppenheim Group
Buyer's Agent
Noemi Romero
The Oppenheim Group
List Price
$3,300,000
Sold Price
$3,300,000
Home Financials for this Owner
Home Financials are based on the most recent Mortgage that was taken out on this home.
Avg. Annual Appreciation
7.09%
Purchase Details
Closed on
Mar 29, 2006
Sold by
Acierno John S and Acierno Luanne E
Bought by
Hansen Peter A and Hansen Carolyn S
Purchase Details
Closed on
Aug 7, 2003
Sold by
Acierno John S and Acierno Luanne E
Bought by
Acierno John S and Acierno Luanne E
Home Financials for this Owner
Home Financials are based on the most recent Mortgage that was taken out on this home.
Original Mortgage
$900,000
Interest Rate
4.75%
Mortgage Type
Purchase Money Mortgage
Purchase Details
Closed on
Jun 29, 2000
Sold by
Gonzalez Edward
Bought by
Acierno John S and Acierno Luanne E
Home Financials for this Owner
Home Financials are based on the most recent Mortgage that was taken out on this home.
Original Mortgage
$596,000
Interest Rate
8.2%
Purchase Details
Closed on
Apr 18, 2000
Sold by
Reed Kathryn E Trust
Bought by
Gonzalez Edward
Home Financials for this Owner
Home Financials are based on the most recent Mortgage that was taken out on this home.
Original Mortgage
$500,000
Interest Rate
10.8%
Similar Homes in the area
Create a Home Valuation Report for This Property
The Home Valuation Report is an in-depth analysis detailing your home's value as well as a comparison with similar homes in the area
Home Values in the Area
Average Home Value in this Area
Purchase History
| Date | Type | Sale Price | Title Company |
|---|---|---|---|
| Grant Deed | $6,250,000 | Ticor Title | |
| Grant Deed | -- | None Available | |
| Grant Deed | -- | None Available | |
| Interfamily Deed Transfer | -- | None Available | |
| Interfamily Deed Transfer | -- | None Available | |
| Grant Deed | $3,300,000 | First American Title Company | |
| Grant Deed | $3,350,000 | Equity Title | |
| Interfamily Deed Transfer | -- | Southland Title | |
| Grant Deed | $745,000 | Commonwealth Land Title | |
| Grant Deed | $625,000 | Commonwealth Land Title |
Source: Public Records
Mortgage History
| Date | Status | Loan Amount | Loan Type |
|---|---|---|---|
| Previous Owner | $700,000 | Credit Line Revolving | |
| Previous Owner | $500,000 | Credit Line Revolving | |
| Previous Owner | $900,000 | Purchase Money Mortgage | |
| Previous Owner | $900,000 | Unknown | |
| Previous Owner | $800,000 | Unknown | |
| Previous Owner | $800,000 | Unknown | |
| Previous Owner | $300,000 | Credit Line Revolving | |
| Previous Owner | $1,029,450 | Construction | |
| Previous Owner | $596,000 | No Value Available | |
| Previous Owner | $500,000 | No Value Available |
Source: Public Records
Property History
| Date | Event | Price | Change | Sq Ft Price |
|---|---|---|---|---|
| 04/17/2025 04/17/25 | Sold | $6,250,000 | -3.8% | $2,377 / Sq Ft |
| 02/25/2025 02/25/25 | Pending | -- | -- | -- |
| 02/20/2025 02/20/25 | For Sale | $6,500,000 | 0.0% | $2,472 / Sq Ft |
| 09/08/2022 09/08/22 | Rented | $17,000 | +13.3% | -- |
| 07/25/2022 07/25/22 | Price Changed | $15,000 | -25.0% | $6 / Sq Ft |
| 06/11/2022 06/11/22 | Price Changed | $20,000 | +33.3% | $8 / Sq Ft |
| 06/07/2022 06/07/22 | Price Changed | $15,000 | -57.1% | $6 / Sq Ft |
| 03/04/2022 03/04/22 | For Rent | $35,000 | +133.3% | -- |
| 11/19/2021 11/19/21 | Rented | $15,000 | 0.0% | -- |
| 10/15/2021 10/15/21 | Price Changed | $15,000 | -40.0% | $6 / Sq Ft |
| 06/28/2021 06/28/21 | For Rent | $25,000 | 0.0% | -- |
| 09/23/2015 09/23/15 | Off Market | $3,300,000 | -- | -- |
| 09/21/2015 09/21/15 | Sold | $3,300,000 | 0.0% | $1,255 / Sq Ft |
| 08/07/2015 08/07/15 | For Sale | $3,300,000 | -- | $1,255 / Sq Ft |
Source: California Regional Multiple Listing Service (CRMLS)
Tax History Compared to Growth
Tax History
| Year | Tax Paid | Tax Assessment Tax Assessment Total Assessment is a certain percentage of the fair market value that is determined by local assessors to be the total taxable value of land and additions on the property. | Land | Improvement |
|---|---|---|---|---|
| 2024 | $40,692 | $3,829,931 | $3,381,819 | $448,112 |
| 2023 | $39,742 | $3,754,835 | $3,315,509 | $439,326 |
| 2022 | $39,086 | $3,681,211 | $3,250,499 | $430,712 |
| 2021 | $38,336 | $3,609,031 | $3,186,764 | $422,267 |
| 2020 | $37,895 | $3,572,025 | $3,154,087 | $417,938 |
| 2019 | $37,104 | $3,501,986 | $3,092,242 | $409,744 |
| 2018 | $36,435 | $3,433,320 | $3,031,610 | $401,710 |
| 2017 | $35,789 | $3,366,000 | $2,972,166 | $393,834 |
| 2016 | $34,983 | $3,300,000 | $2,913,888 | $386,112 |
| 2015 | $30,555 | $2,862,000 | $2,412,000 | $450,000 |
| 2014 | $28,342 | $2,664,000 | $2,214,000 | $450,000 |
Source: Public Records
Agents Affiliated with this Home
-
Nicolai Glazer
Seller's Agent in 2025
Nicolai Glazer
Pacific Sotheby's Int'l Realty
(949) 644-6200
33 in this area
94 Total Sales
-
Amelie Mason
Buyer's Agent in 2025
Amelie Mason
Pacific Sotheby's Int'l Realty
(949) 287-1021
20 in this area
31 Total Sales
-
K
Seller's Agent in 2022
Kathy Clark
Harcourts Blue Water
(949) 283-2833
65 Total Sales
-
Buyer's Agent in 2022
Alexa Grant
Compass
(949) 338-7097
5 Total Sales
-
Vicki Lee
Buyer's Agent in 2021
Vicki Lee
Compass
(949) 466-3224
3 in this area
25 Total Sales
-
Noemi Romero
Seller's Agent in 2015
Noemi Romero
The Oppenheim Group
(714) 330-1064
52 Total Sales
Map
Source: California Regional Multiple Listing Service (CRMLS)
MLS Number: OC15209972
APN: 423-073-08
Disclaimer: Certain information contained herein is derived from information provided by parties other than Homes.com. All information provided is deemed reliable, but is not guaranteed to be accurate and should be independently verified.
![]() The multiple listing data appearing on this website, or contained in reports produced therefrom, is owned and copyrighted by California Regional Multiple Listing Service, Inc. ("CRMLS") and is protected by all applicable copyright laws. Information provided is for viewer's personal, non-commercial use and may not be used for any purpose other than to identify prospective properties the viewer may be interested in purchasing. All listing data, including but not limited to square footage and lot size is believed to be accurate, but the listing Agent, listing Broker and CRMLS and its affiliates do not warrant or guarantee such accuracy. The viewer should independently verify the listed data prior to making any decisions based on such information by personal inspection and/or contacting a real estate professional.
The multiple listing data appearing on this website, or contained in reports produced therefrom, is owned and copyrighted by California Regional Multiple Listing Service, Inc. ("CRMLS") and is protected by all applicable copyright laws. Information provided is for viewer's personal, non-commercial use and may not be used for any purpose other than to identify prospective properties the viewer may be interested in purchasing. All listing data, including but not limited to square footage and lot size is believed to be accurate, but the listing Agent, listing Broker and CRMLS and its affiliates do not warrant or guarantee such accuracy. The viewer should independently verify the listed data prior to making any decisions based on such information by personal inspection and/or contacting a real estate professional.
Based on information from California Regional Multiple Listing Service, Inc. and /or other sources. All data, including all measurements and calculations of area, is obtained from various sources and has not been, and will not be, verified by broker or MLS. All information should be independently reviewed and verified for accuracy. Properties may or may not be listed by the office/agent presenting the information
Nearby Homes