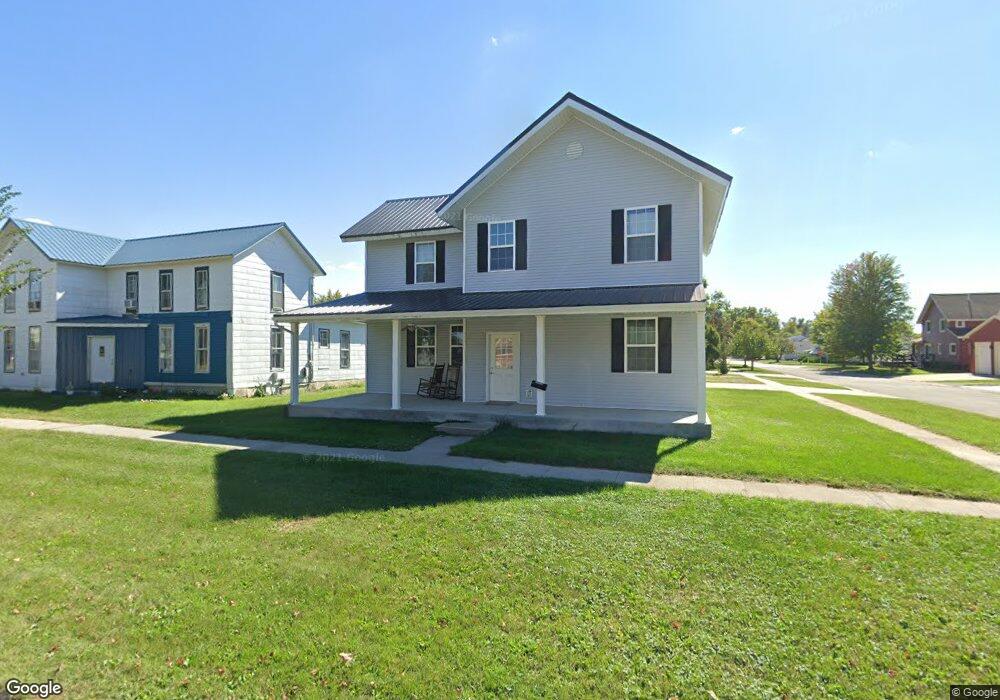
402 E 4th St Vinton, IA 52349
Estimated Value: $210,000 - $282,000
3
Beds
2
Baths
2,032
Sq Ft
$113/Sq Ft
Est. Value
About This Home
This home is located at 402 E 4th St, Vinton, IA 52349 and is currently estimated at $229,157, approximately $112 per square foot. 402 E 4th St is a home located in Benton County with nearby schools including Tilford Elementary School, Vinton-Shellsburg Middle School, and Vinton-Shellsburg High School.
Ownership History
Date
Name
Owned For
Owner Type
Purchase Details
Closed on
Dec 10, 2013
Sold by
Dunham Wayne M
Bought by
Real Estate And Land Investors Llc
Current Estimated Value
Purchase Details
Closed on
Sep 11, 2008
Sold by
Duetsche Bank National Trust Co
Bought by
Dunham Wayne M
Purchase Details
Closed on
Apr 16, 2008
Sold by
Steffen Pandall W and Steffen Kellett R
Bought by
Deutsche Bank National Trust Co
Create a Home Valuation Report for This Property
The Home Valuation Report is an in-depth analysis detailing your home's value as well as a comparison with similar homes in the area
Home Values in the Area
Average Home Value in this Area
Purchase History
| Date | Buyer | Sale Price | Title Company |
|---|---|---|---|
| Real Estate And Land Investors Llc | $15,000 | None Available | |
| Dunham Wayne M | $23,500 | None Available | |
| Deutsche Bank National Trust Co | $45,475 | None Available |
Source: Public Records
Tax History
| Year | Tax Paid | Tax Assessment Tax Assessment Total Assessment is a certain percentage of the fair market value that is determined by local assessors to be the total taxable value of land and additions on the property. | Land | Improvement |
|---|---|---|---|---|
| 2025 | $3,856 | $230,400 | $15,200 | $215,200 |
| 2024 | $3,856 | $205,800 | $14,600 | $191,200 |
| 2023 | $3,602 | $205,800 | $14,600 | $191,200 |
| 2022 | $3,698 | $167,400 | $11,600 | $155,800 |
| 2021 | $3,698 | $167,400 | $11,600 | $155,800 |
| 2020 | $3,472 | $160,400 | $12,900 | $147,500 |
| 2019 | $3,334 | $160,400 | $12,900 | $147,500 |
| 2018 | $3,238 | $152,100 | $12,400 | $139,700 |
| 2017 | $3,120 | $152,100 | $12,400 | $139,700 |
| 2016 | $2,920 | $142,200 | $11,600 | $130,600 |
| 2015 | $2,920 | $135,300 | $11,600 | $123,700 |
| 2014 | $876 | $30,300 | $0 | $0 |
Source: Public Records
Map
Nearby Homes
Your Personal Tour Guide
Ask me questions while you tour the home.