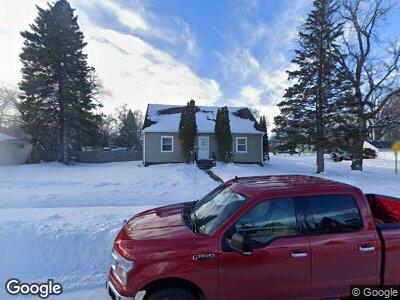
402 Francis St West Fargo, ND 58078
Francis NeighborhoodEstimated Value: $319,000 - $357,263
4
Beds
2
Baths
2,668
Sq Ft
$127/Sq Ft
Est. Value
About This Home
This home is located at 402 Francis St, West Fargo, ND 58078 and is currently estimated at $338,132, approximately $126 per square foot. 402 Francis St is a home located in Cass County with nearby schools including Westside Elementary School, Cheney Middle School, and West Fargo High School.
Ownership History
Date
Name
Owned For
Owner Type
Purchase Details
Closed on
Jul 7, 2017
Sold by
Bannor Amy
Bought by
Fyffe Thomas
Current Estimated Value
Home Financials for this Owner
Home Financials are based on the most recent Mortgage that was taken out on this home.
Original Mortgage
$218,000
Outstanding Balance
$183,537
Interest Rate
3.94%
Mortgage Type
VA
Estimated Equity
$154,595
Purchase Details
Closed on
Nov 25, 2014
Sold by
Pikalek Nathanial J and Pikalek Holly
Bought by
Bannor Amy
Home Financials for this Owner
Home Financials are based on the most recent Mortgage that was taken out on this home.
Original Mortgage
$170,905
Interest Rate
3.97%
Mortgage Type
New Conventional
Purchase Details
Closed on
Mar 3, 2014
Sold by
Smith Jennifer and Olson Jennifer C
Bought by
Smith Todd A and Pikalek Nathanial J
Purchase Details
Closed on
Sep 5, 2007
Sold by
Fett Derek S
Bought by
Olson Jennifer C and Pikalek Nathanial J
Home Financials for this Owner
Home Financials are based on the most recent Mortgage that was taken out on this home.
Original Mortgage
$131,900
Interest Rate
6.72%
Mortgage Type
New Conventional
Create a Home Valuation Report for This Property
The Home Valuation Report is an in-depth analysis detailing your home's value as well as a comparison with similar homes in the area
Home Values in the Area
Average Home Value in this Area
Purchase History
| Date | Buyer | Sale Price | Title Company |
|---|---|---|---|
| Fyffe Thomas | $218,000 | Title Co | |
| Bannor Amy | $179,900 | None Available | |
| Smith Todd A | -- | None Available | |
| Olson Jennifer C | -- | -- |
Source: Public Records
Mortgage History
| Date | Status | Borrower | Loan Amount |
|---|---|---|---|
| Open | Fyffe Thomas | $46,581 | |
| Open | Fyffe Thomas | $218,000 | |
| Previous Owner | Bannor Amy | $170,000 | |
| Previous Owner | Bannor Amy | $170,905 | |
| Previous Owner | Pikalek Nathanial J | $127,967 | |
| Previous Owner | Olson Jennifer C | $131,900 | |
| Previous Owner | Fett Derek S | $30,000 | |
| Previous Owner | Fett Derek S | $25,000 |
Source: Public Records
Tax History Compared to Growth
Tax History
| Year | Tax Paid | Tax Assessment Tax Assessment Total Assessment is a certain percentage of the fair market value that is determined by local assessors to be the total taxable value of land and additions on the property. | Land | Improvement |
|---|---|---|---|---|
| 2024 | $3,681 | $137,850 | $28,050 | $109,800 |
| 2023 | $3,723 | $139,050 | $28,050 | $111,000 |
| 2022 | $3,531 | $127,100 | $28,050 | $99,050 |
| 2021 | $3,315 | $112,000 | $20,400 | $91,600 |
| 2020 | $3,232 | $112,300 | $20,400 | $91,900 |
| 2019 | $3,146 | $109,200 | $20,400 | $88,800 |
| 2018 | $2,941 | $106,450 | $20,400 | $86,050 |
| 2017 | $2,530 | $95,300 | $20,400 | $74,900 |
| 2016 | $2,237 | $92,450 | $20,400 | $72,050 |
| 2015 | $1,989 | $75,250 | $16,250 | $59,000 |
| 2014 | $1,950 | $70,350 | $16,250 | $54,100 |
| 2013 | $1,982 | $70,350 | $16,250 | $54,100 |
Source: Public Records
Map
Nearby Homes