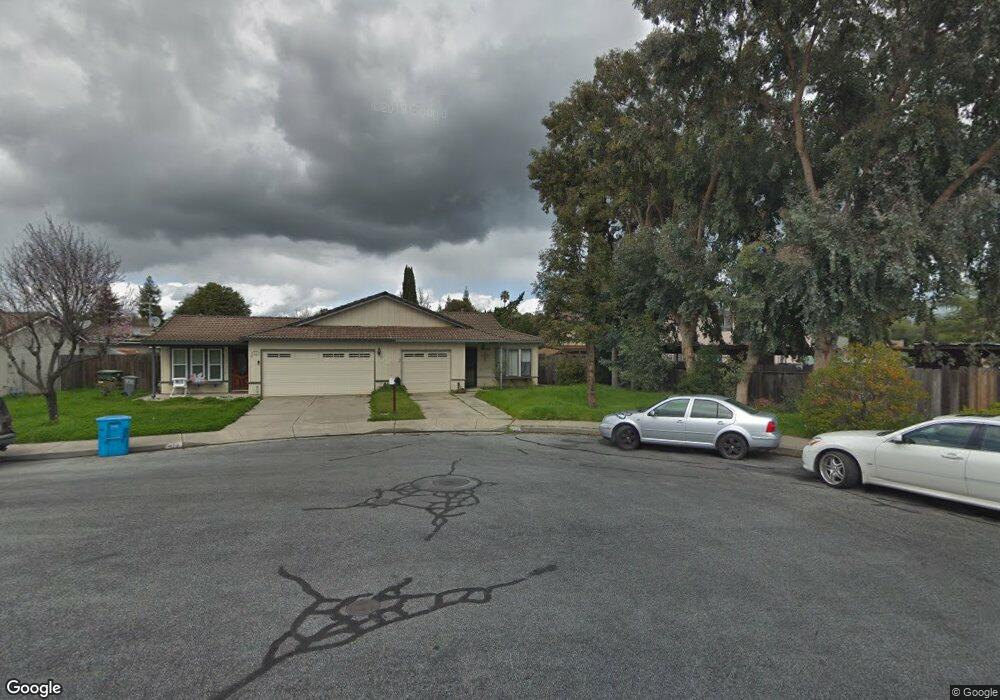
402 Hadley Ct Gilroy, CA 95020
Estimated Value: $508,000 - $775,000
2
Beds
2
Baths
1,160
Sq Ft
$572/Sq Ft
Est. Value
About This Home
This home is located at 402 Hadley Ct, Gilroy, CA 95020 and is currently estimated at $663,360, approximately $571 per square foot. 402 Hadley Ct is a home located in Santa Clara County with nearby schools including Eliot Elementary School, Brownell Middle School, and Solorsano Middle School.
Ownership History
Date
Name
Owned For
Owner Type
Purchase Details
Closed on
Sep 27, 2010
Sold by
Montes Elizabeth
Bought by
Marquez Priscilla A
Current Estimated Value
Home Financials for this Owner
Home Financials are based on the most recent Mortgage that was taken out on this home.
Original Mortgage
$187,475
Outstanding Balance
$125,402
Interest Rate
4.62%
Mortgage Type
FHA
Estimated Equity
$537,958
Purchase Details
Closed on
May 25, 2004
Sold by
Casoria Pedro
Bought by
Montes Elizabeth
Home Financials for this Owner
Home Financials are based on the most recent Mortgage that was taken out on this home.
Original Mortgage
$304,000
Interest Rate
5.37%
Mortgage Type
Purchase Money Mortgage
Purchase Details
Closed on
Dec 16, 1993
Sold by
Raygoza Enriqueta and Villagrana Enrigueta P
Bought by
Raygoza Enriqueta
Home Financials for this Owner
Home Financials are based on the most recent Mortgage that was taken out on this home.
Original Mortgage
$93,000
Interest Rate
7.2%
Create a Home Valuation Report for This Property
The Home Valuation Report is an in-depth analysis detailing your home's value as well as a comparison with similar homes in the area
Home Values in the Area
Average Home Value in this Area
Purchase History
| Date | Buyer | Sale Price | Title Company |
|---|---|---|---|
| Marquez Priscilla A | $190,000 | Old Republic Title Company | |
| Montes Elizabeth | -- | Financial Title Company | |
| Montes Elizabeth | $380,000 | Financial Title Company | |
| Raygoza Enriqueta | -- | Old Republic Title Company |
Source: Public Records
Mortgage History
| Date | Status | Borrower | Loan Amount |
|---|---|---|---|
| Open | Marquez Priscilla A | $187,475 | |
| Previous Owner | Montes Elizabeth | $304,000 | |
| Previous Owner | Raygoza Enriqueta | $93,000 | |
| Closed | Montes Elizabeth | $76,000 |
Source: Public Records
Tax History
| Year | Tax Paid | Tax Assessment Tax Assessment Total Assessment is a certain percentage of the fair market value that is determined by local assessors to be the total taxable value of land and additions on the property. | Land | Improvement |
|---|---|---|---|---|
| 2025 | $4,095 | $243,409 | $109,532 | $133,877 |
| 2024 | $4,095 | $238,637 | $107,385 | $131,252 |
| 2023 | $3,132 | $233,959 | $105,280 | $128,679 |
| 2022 | $2,989 | $229,372 | $103,216 | $126,156 |
| 2021 | $2,973 | $224,876 | $101,193 | $123,683 |
| 2020 | $2,941 | $222,571 | $100,156 | $122,415 |
| 2019 | $2,914 | $218,208 | $98,193 | $120,015 |
| 2018 | $2,725 | $213,930 | $96,268 | $117,662 |
| 2017 | $2,780 | $209,736 | $94,381 | $115,355 |
| 2016 | $2,717 | $205,625 | $92,531 | $113,094 |
| 2015 | $2,566 | $202,538 | $91,142 | $111,396 |
| 2014 | $2,549 | $198,571 | $89,357 | $109,214 |
Source: Public Records
Map
Nearby Homes
- 332 Lewis St Unit 1/2
- 332 Lewis St
- 7727 Murray Ave
- 7621 Forest St
- 262 E 6th St
- 7429 Alexander St
- 160 Sarafina Way
- 0 Monterey Rd
- 7711 Monterey St
- 194 4th St
- 0 Pacheco Pass Hwy
- 8282 Murray Ave Unit 99
- 7691 Church St Unit B
- 7601 Rosanna St
- 7630 Hanna St
- 7051 Eigleberry St
- 7681 Hanna St
- 440 W 7th St
- 0 Magic Springs Dr Unit ML82028522
- 0 Dorrance Rd Unit ML82002071
- 412 Hadley Ct
- 422 Hadley Ct
- 7537 Rogers Ln Unit 1
- 7537 Rogers Ln Unit 3
- 7537 Rogers Ln Unit 4
- 574 Hoover Ct
- 564 Hoover Ct
- 432 Hadley Ct
- 7515 Rogers Ln
- 554 Hoover Ct
- 409 Hadley Ct
- 442 Hadley Ct
- 439 Hadley Ct
- 544 Hoover Ct
- 419 Hadley Ct
- 429 Hadley Ct
- 449 Hadley Ct
- 452 Hadley Ct
- 534 Hoover Ct
- 459 Hadley Ct
Your Personal Tour Guide
Ask me questions while you tour the home.